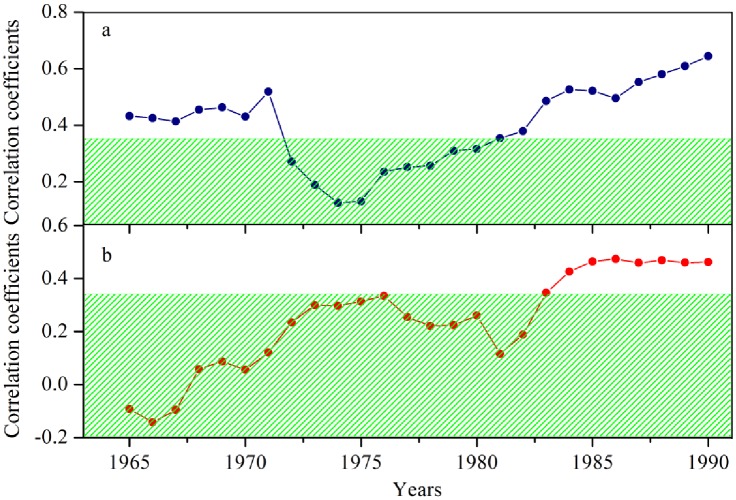
Fig 6. Temporal changes of the growth-climate relationships as shown by moving correlations between tree growth and a) November-January average temperature and b) June precipitation totals using a sliding window of 30 years assigned to the center year of the window.
The shaded areas are the 95% confidence limits.

