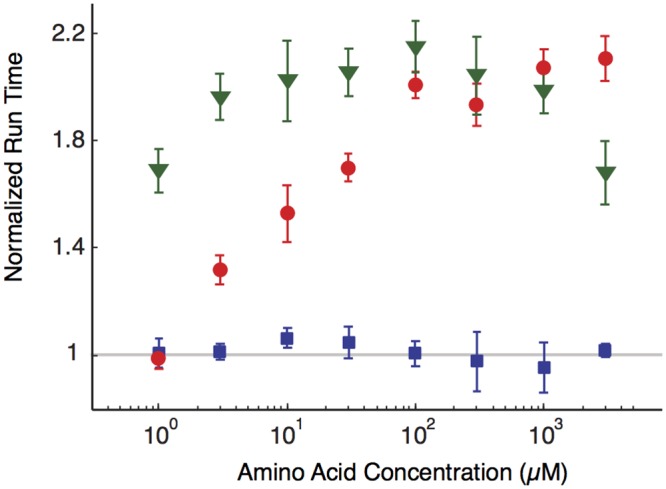
Fig 2. Variation of the bacterial running time with respect to the chemoattractant concentrations.

The curves refer to different concentrations of serine (red), aspartate (blue) or aspartate with a background of 30μM of serine (green). Times are normalized to the average running time (whence a non-dimensional quantity on the y-axis) in the absence of any chemoattractant, whose average over the bacterial population is ≃1.15s. Run times are calculated by averaging over at least three different experiments and error bars represent the error on the mean. The loss of precise adaptation for the green and the red curves is clearly visible. Note also that the value of the green curve at the lowest aspartate concentration is consistent with the value of the red curve at 30μM, as expected by the fact that the serine background becomes dominant.
