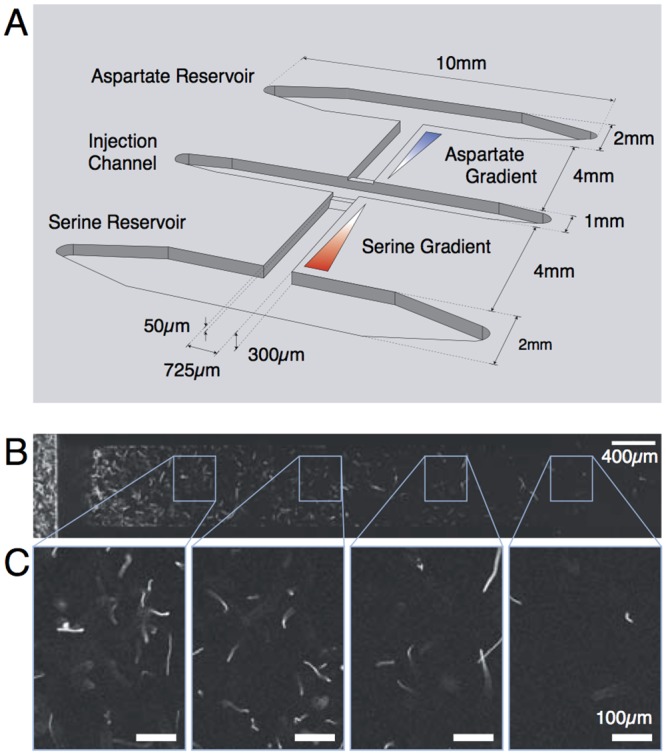
Fig 4. The experimental setup and raw images of bacteria running in the channels.

A. Illustration of the microfluidic setup where bacterial speed races take place. Reservoirs were filled with the appropriate concentration of chemoattractants and let diffuse through the lateral channels so as to establish linear gradients of chemoattractants in equilibrium with the flow of motility medium applied in the injection channel. Bacteria were then inserted into the injection channel and a fraction of them climb gradients of chemoattractants in the lateral channels. B. A typical stitched fluorescence image of a channel. A sequence of 20 images (exposure time of 200ms) were superimposed and then stitched together. On the extreme left, it is shown the injection channels, where the density of bacteria is the highest, while successive positions along the lateral channel are presented moving from the left to the right of the panel. C. A zoom of the images in panel B at diverse positions along the lateral channels.
