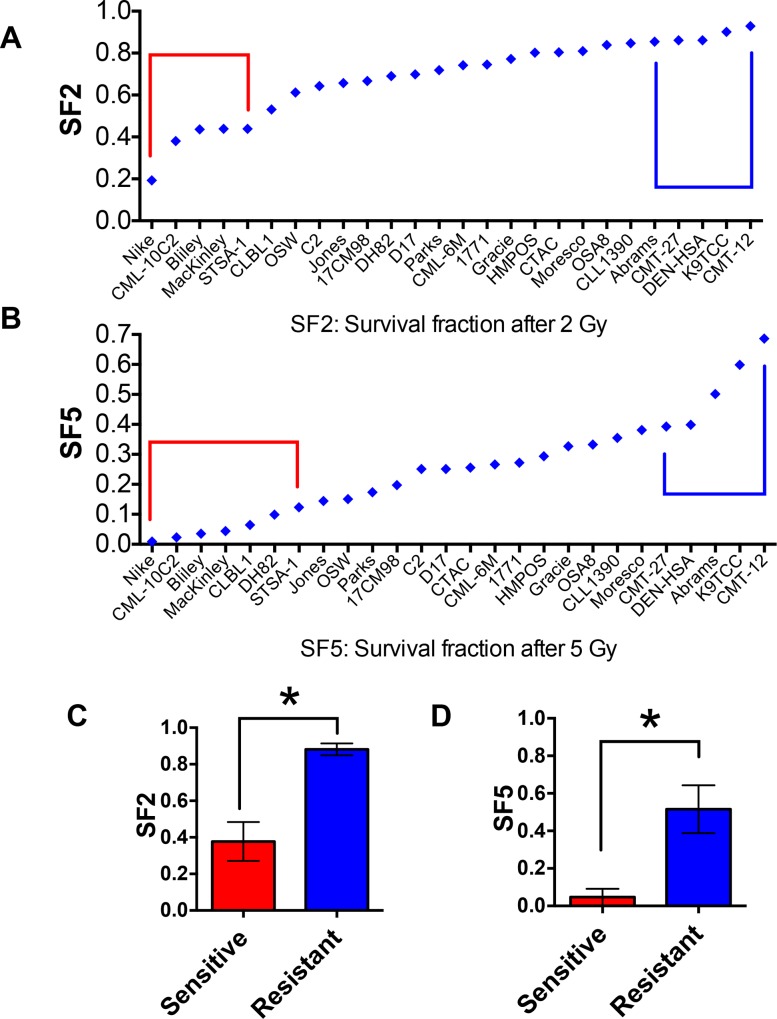
Fig 3. The measured SF2 and SF5 of 27 canine tumor cell lines.
27 cell lines are ranked based on SF2 (A) and SF5 (B). Red circle: radiosensitive group, blue circle: radioresistant group. (C, D) Comparison between the mean values of two groups based on the SF2 (C) or SF5 (D). Error bars indicate standard deviation. * p<0.001 versus sensitive and resistant group (unpaired t-test).

