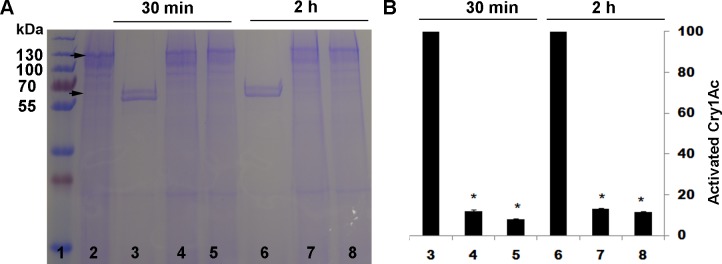
Fig 1. Activation of Cry1Ac protoxin by trypsin with and without the trypsin inhibitor TLCK.
(A) Representative SDS-PAGE gel. (B) Percentage activation (mean and SE) based on optical density of the activated toxin band (65 kDa) relative to the band with only protoxin (lane 2) calculated by Image J quantification from three replicates. Asterisks indicate significantly lower activation with inhibitor than without for a given incubation period: 30 min for lanes 4 and 5 versus lane 3 and 2 h for lanes 7 and 8 versus lane 6 (t-tests, P < 0.05). Lane 1, molecular weight markers (kDa); Lane 2, Cry1Ac protoxin; Lanes 3 and 6, Cry1Ac protoxin and trypsin; Lanes 4 and 7, Cry1Ac protoxin and 10:1 trypsin + TLCK; Lanes 5 and 8, Cry1Ac protoxin and 1:1 trypsin + TLCK.

