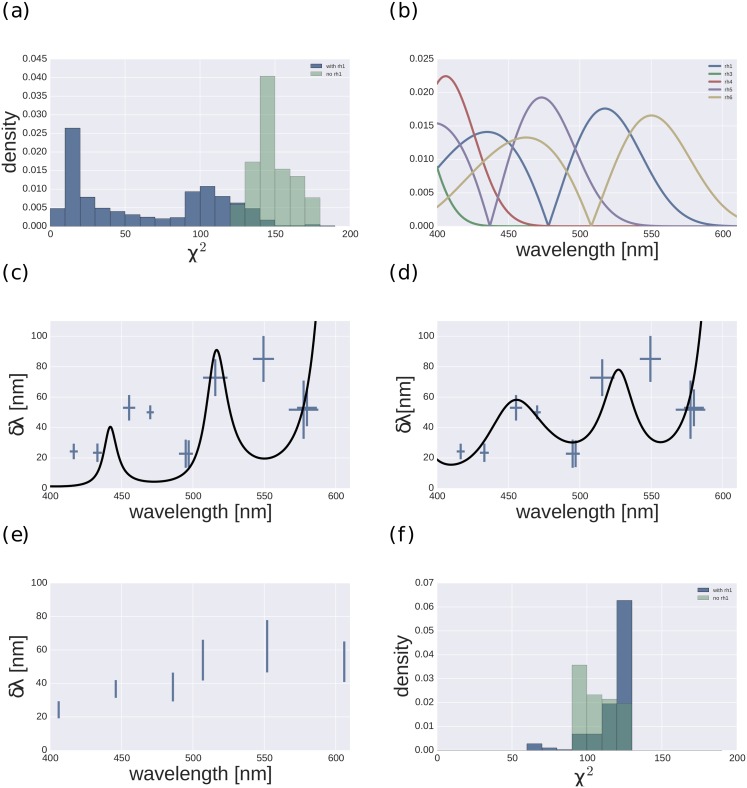
Fig 2. Fit statistic over all possible models and the best fitting models.
(a) Histograms of χ2 values for all fits of models without Rh1 (green) and with Rh1 (blue). (b) Absolute slopes of Drosophila opsins in the visual range. (c),(d) Best fitting models without Rh1 (i.e. Rh4-Rh6, Rh5-Rh3; weights:609.9 177.1) and with Rh1 (Rh1-Rh6, Rh4-Rh6; weights 100.5, 84.4). (e) Mean-transformed data. (f) Histogram of χ2 values for fits of the mean-transformed data for models without Rh1 (green) and with Rh1 (blue).

