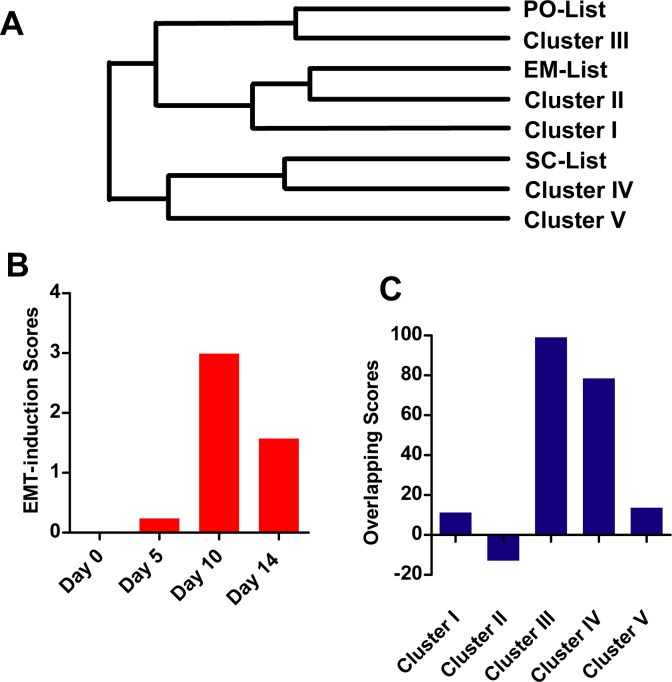
Fig 6. EMT during neuron trans-differentiation.
(A) The 773-gene list in S5 Table was used to determine the correlation between PO-lists, EM-list, SC-list and gene lists identified in five clusters. Identification of the 773 genes in all the eight lists were remarked as “1” in S5 Table. The samples were merged in close proximity using the farthest neighbor clustering method in linkage criteria, i.e. complete linkage. (B) Four scoring systems mentioned above were used to evaluate the expression change during neuron trans-differentiation (GSE68902). (C) The expression changes on Day 10 during neuron trans-differentiation (GSE68902) were evaluated by gene listed from five clusters as described in Materials and Methods. Overlapping score was calculated by subtracting the absolute log2 values of genes with opposite expression changes from the summary of genes with consistent expression changes.

