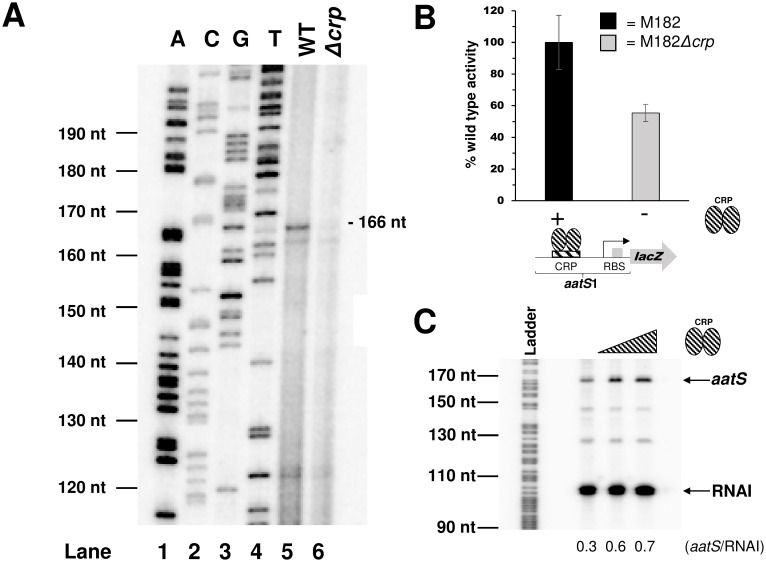
Fig 2. Characterisation of the PaatS promoter.
A. Primer extension analysis of the aatS transcript. Lanes 1–4 on the gel are arbitrary size standards, used for calibration, generated by sequencing of M13mp18 phage DNA. Lane 5 shows the primer extension product generated using RNA from wildtype M182 cells carrying the aatS1::lacZ fusion. Lane 6 shows the primer extension product generated using RNA from M182Δcrp cells carrying the aatS1::lacZ fusion. The transcription start site is indicated in Fig 1B. B. β-galactosidase activity determined using lysates of M182 wildtype or M182Δcrp cells carrying PaatS cloned upstream of lacZ in plasmid pRW50. Values shown are percentages of activity observed in strain M182 (92 Miller units). We obtained 7 and 3 Miller units of activity from lysates of M182 or M182Δcrp carrying promoterless pRW50. Error bars represent the standard deviation of three independent experiments. C. Multi-round in vitro transcription assay using PaatS. The aatS1 DNA fragment was cloned into pSR upstream of a λoop terminator. Purified, supercoiled pSR plasmid was incubated with purified CRP at 37°C, and the reaction started by the addition of 400 nM σ70- RNA polymerase holoenzyme. CRP concentrations are; 0 nM, 200 nM, or 400 nM. The 108 nt RNAI transcript from the pSR replication origin, and the 169 nt transcript from PaatS, are indicated. The gel is calibrated with an arbitrary G+A DNA sequencing reaction as a size standard.

