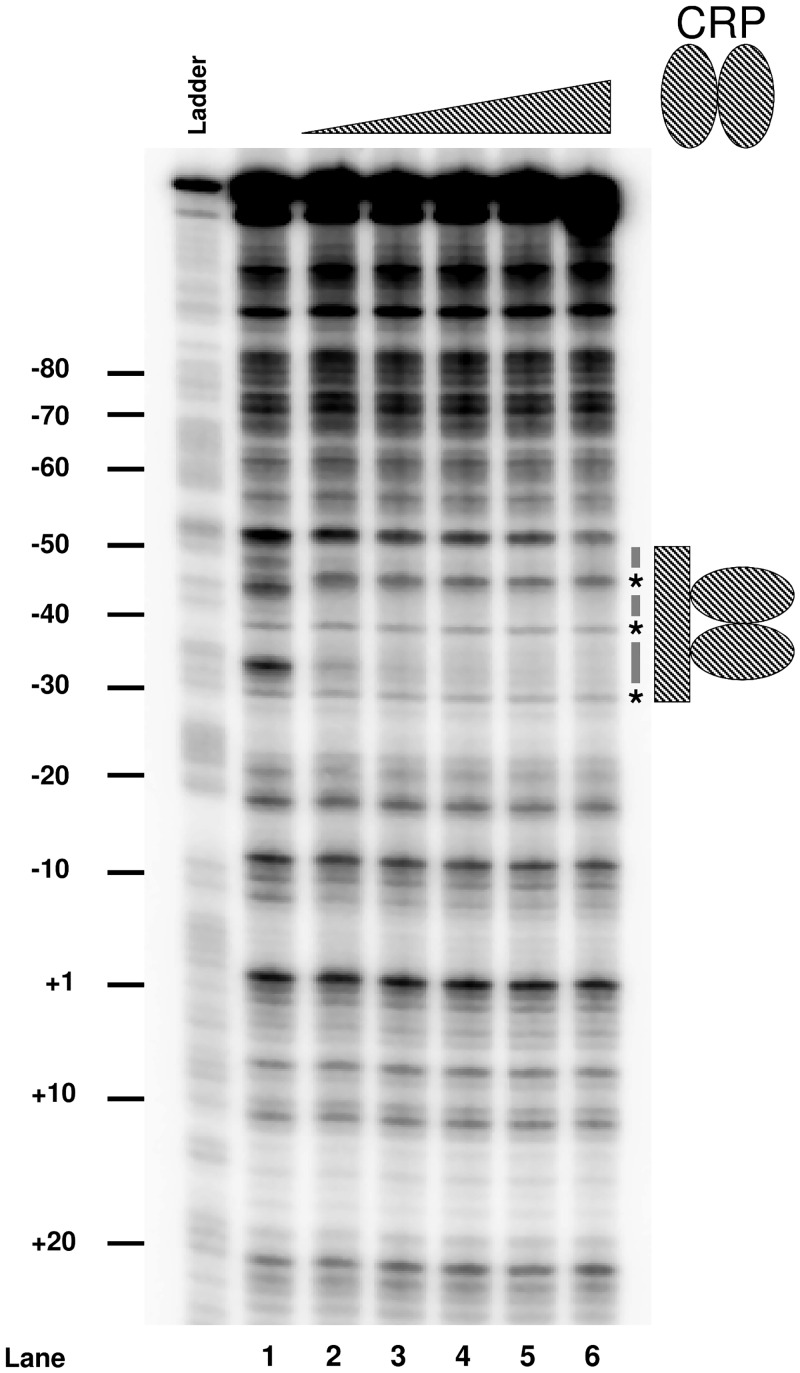
Fig 3. Binding of CRP to the PaatS region.
DNAse I footprint analysis of the PaatS region. The lane labelled ‘G+A’ is a Maxim/Gilbert G+A sequencing reaction. Lane 1 shows the cleavage pattern obtained from aatS1 DNA digested with DNAse I in the absence of CRP. Lanes 2–6 show DNAse I cleavage patterns generated in the presence of increasing concentrations of CRP (0.35 μM, 0.7 μM, 1.05 μM, 1.4 μM and 2.1 μM). The predicted CRP site is indicated by a hashed grey bar. DNA protection is indicated by black dashes, hypersensitive bends are highlighted by stars.

