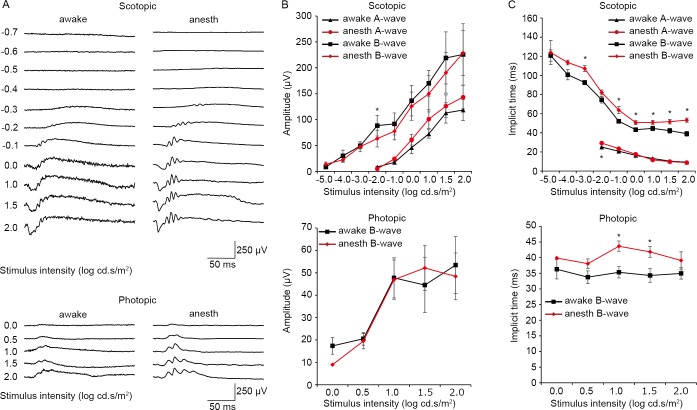
Fig 2. Awake and anesthetized ERG from the same mice.
A. Representative traces of scotopic (top) and photopic (bottom) ERGs recorded from the same mouse in the awake (left) and anesthetized (right) condition. B. Amplitudes of scotopic (top) and photopic (bottom) ERG waves from the same mice recorded in awake (black) and anesthetized (red) conditions. C. Implicit times of scotopic (top) and photopic (bottom) ERG waves from the same mice recorded in awake (black) and anesthetized (red) conditions. * P < 0.05. Data from seven mice. The bars indicate mean ± standard error of the mean (S.E.M). anes: anesthetized.

