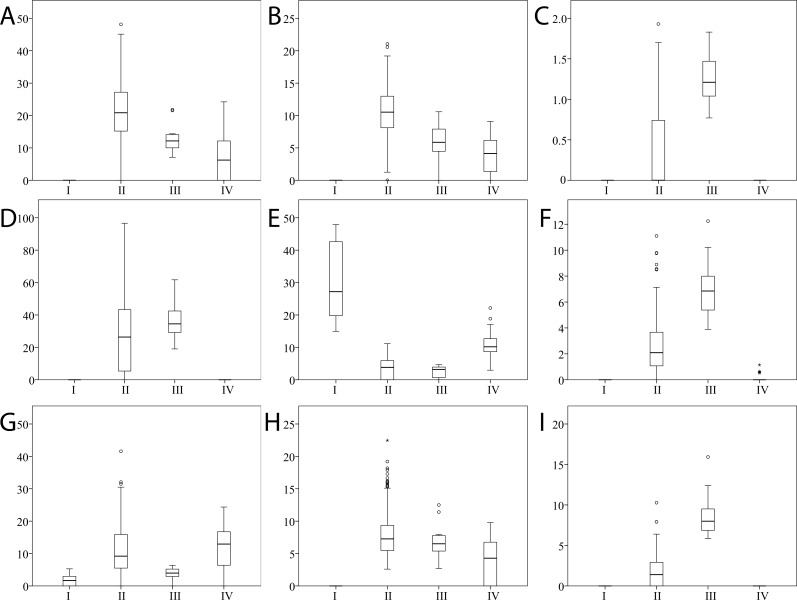
Fig 3. Boxplots stratified on the 4 clusters showing peak intensities across the sample population for the 9 peaks determining the clustering structure.
X-axis contains the 4 clusters. Y-axis contains the peak intensity, scaled from 0 (minimum detection level) to 100 (maximum detected intensity of any peak across all samples and peaks). Peaks are listed in decreasing order of their importance for the clustering, same as in Table 2. (A) P-C peptide, Fr. 15–44. (B) P-C peptide, Fr. 1–25. (C) unidentified peak (m/z = 5980). (D) P-C peptide (1+ charge). (E) unidentified peak (m/z = 2725). (F) Cystatin B, Fr. 1–53. (G) P-C peptide, Fr. 15–35. (H) P-C peptide (2+ charge). (I) II-2 basic proline-rich protein, phosphorylated.

