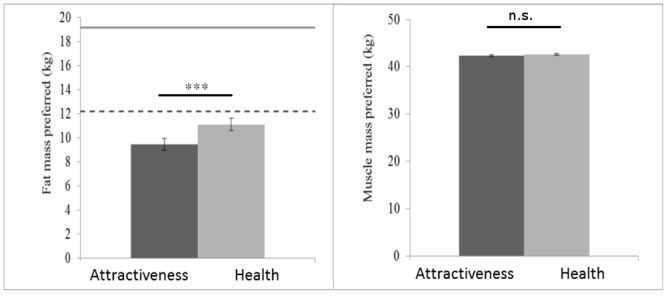
Fig 4. Preferred body fat and muscle mass of women’s bodies.

Observers prefer lower fat mass to optimise the attractive appearance of women’s bodies than to optimise the healthy appearance of women’s bodies (left). No difference is found in the amount of muscle mass chosen to optimise the attractive and healthy appearance of women’s bodies (right). Error bars show standard error of the mean. Dashed line shows lower bound of healthy fat mass (kg) and solid line shows the upper bound of healthy fat mass (kg) for young women with the body mass of the average female subject identity in this study. *** p < .001.
