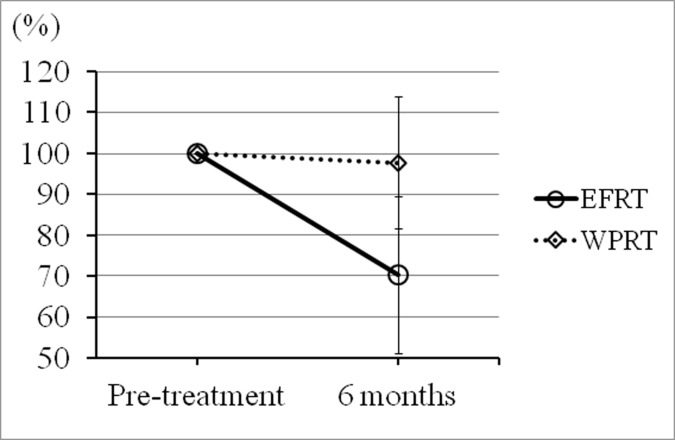
Fig 1. The ratios of pre-treatment creatinine clearance values to those 6 months after treatment (the pretreatment values were taken to be 100%).
Mean ratios for all 10 EFRT patients and all 8 WPRT patients (○: EFRT and ◇: WPRT) are shown by the time elapsed from the first day of treatment. The renal function of the EFRT group (with kidney irradiation) was lower 6 months after treatment compared to those of the WPRT group (without kidney irradiation) (P = 0.005). Each error bar represents one standard deviation (SD) of the means for each group 6 months after treatment.

