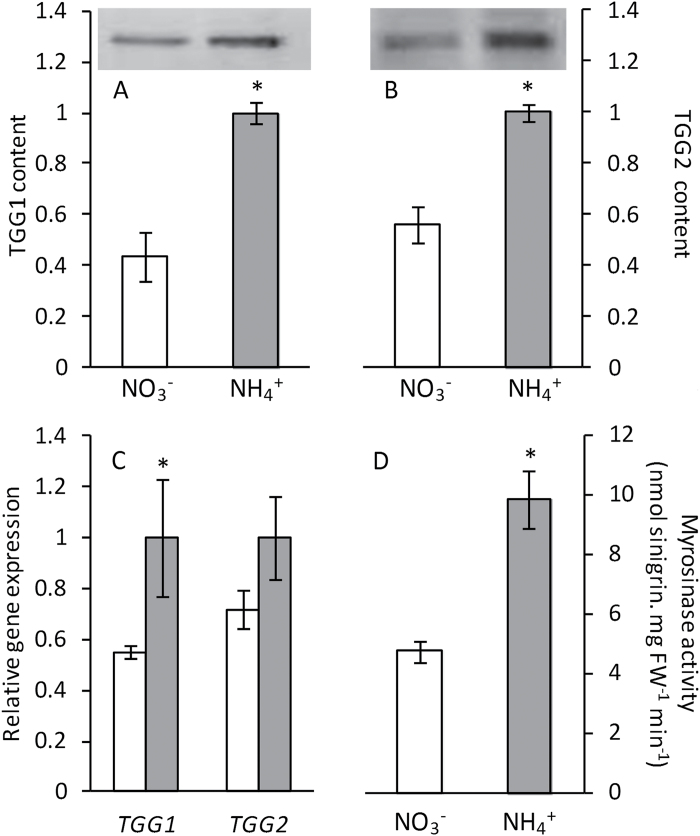
Fig. 3.
TGG1 (A) and TGG2 (B) content, and gene expression (C) and myrosinase activity (D) of A. thaliana plants grown with nitrate or ammonium as the nitrogen source. White bars represent plants grown under nitrate nutrition, and grey bars under ammonium nutrition. Values represent mean±SE (n=6). Statistical differences according to a Student’s t-test P value < 0.05 are indicated by an asterisk.

