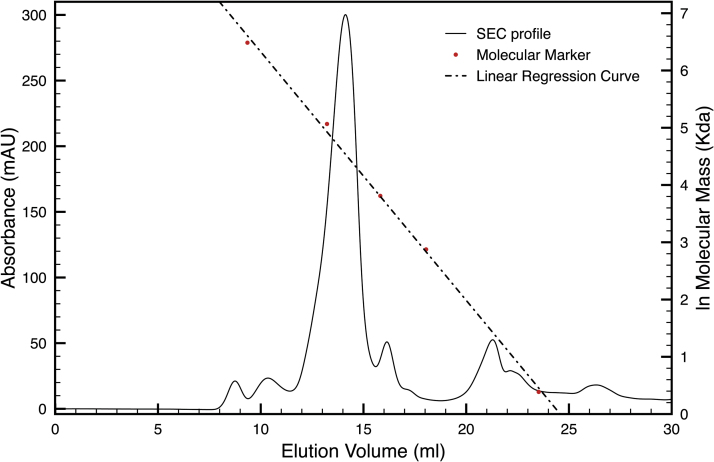
Fig. 2.
SEC profile of the extracted protein after buffer dilution and concentration. The sample separates into a dominant peak with minor impurities at lower masses. A polynomial regression curve is shown (dotted line) calculated on the basis of the retention volumes of the molecular standard (blue dots). The red dot on the polynomial regression curve shows the calculated mass of the isolated protein.

