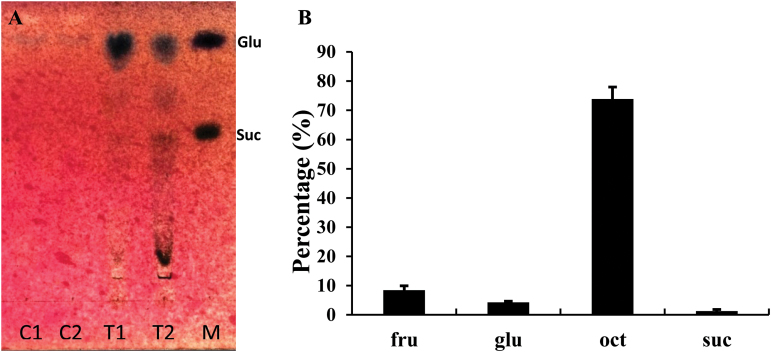
Fig. 5.
Thin layer chromatogram (a) and GC analysis of leaf exudates (b) of C. plantagineum. C1 and C2 are two replicates of the sugars exported into 5mM CaCl2 from leaves (control); T1 and T2 are two replicates of the sugars exported into 15mM EDTA (leaf exudates); Lane M contains glucose (Glu) and sucrose (Suc) standards. The GC analysis shows the percentage of sugars relative to total sugars. All data represent means ±SD (n=3).

