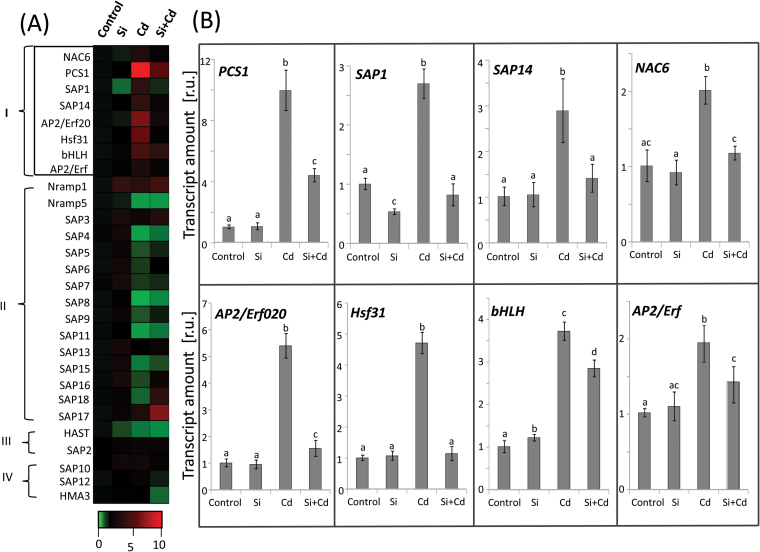
Fig. 5.
Response pattern of transcripts in rice roots grown with or without Cd and supplementary Si. (A) Expression profiles of transcripts 4 d after Si supply represented as a heat map. Based on their differential response to Cd and Si, transcripts were classified into four groups (see text for details, and Supplementary Fig. S2 with Group II–Group IV category members). In (B), the transcriptional response of targets following the recovery pattern (Group I) are shown. Data are means ±SD (n=6) from three independent experiments. Data groups of significant difference were calculated by t-test and are labeled with different letters (P<0.05). (This figure is available in colour at JXB online.)

