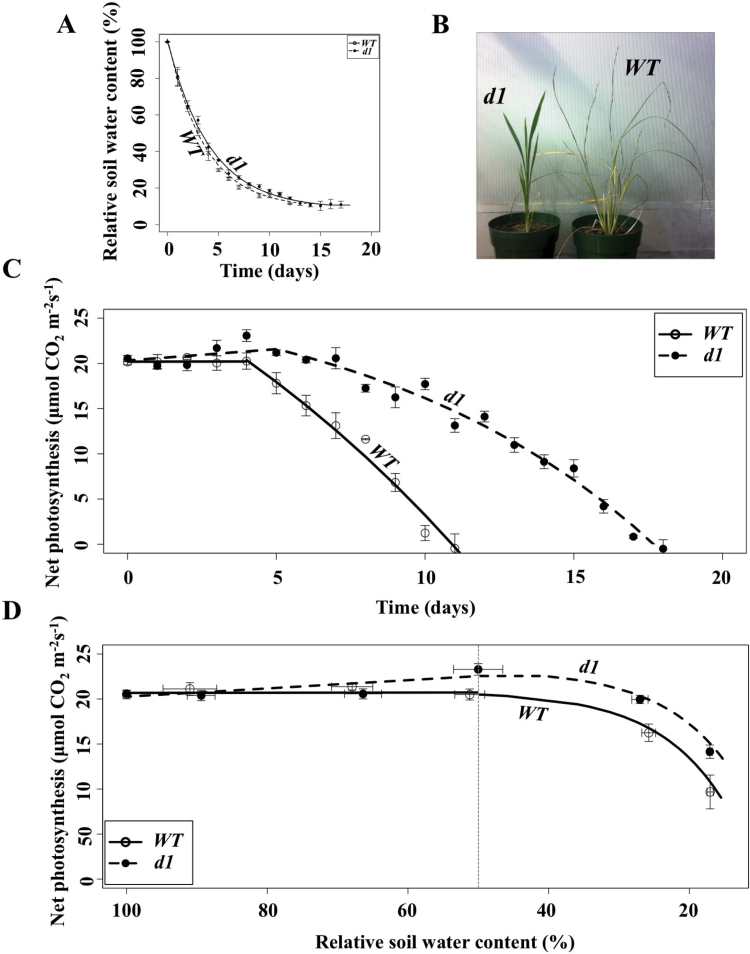
Fig. 1.
Wild-type (WT) plants are notably more affected by water limitation than d1 plants. (A) Pots in which WT plants were grown lost water from the soil at a rate identical to that for pots in which d1 plants were grown. Fits were obtained using a decay function (Supplementary Table S1). Open circles are data points for the WT, and filled circles are data points for d1. Model fits are shown with a solid line for the WT and a dashed line for d1. This notation is used in all of the figures. (B) Photograph of representative WT and d1 plants taken 14 d after water was withheld. (C) WT plants exhibit a steeper decline in CO2 fixation as soil dries out. Fits were made using a linear fit for the response until day 4 (Supplementary Table S2) and a saturating exponential fit for the response from day 4 onward (Supplementary Table S3). (D) Net photosynthesis increases in d1 as relative soil water content (RSWC) declines to ~50% while net photosynthesis for the WT remains constant over this period. Subsequently, net photosynthesis declines more gradually in d1 than in the WT. Data were fitted to a linear model to characterize the results from 100% RSWC to 50% RSWC (Supplementary Table S4), and to a saturating exponential equation for the response from 50% to 15% RSWC (Supplementary Table S5). The vertical dotted line indicates 50% RSWC. (This figure is available in colour at JXB online.)

