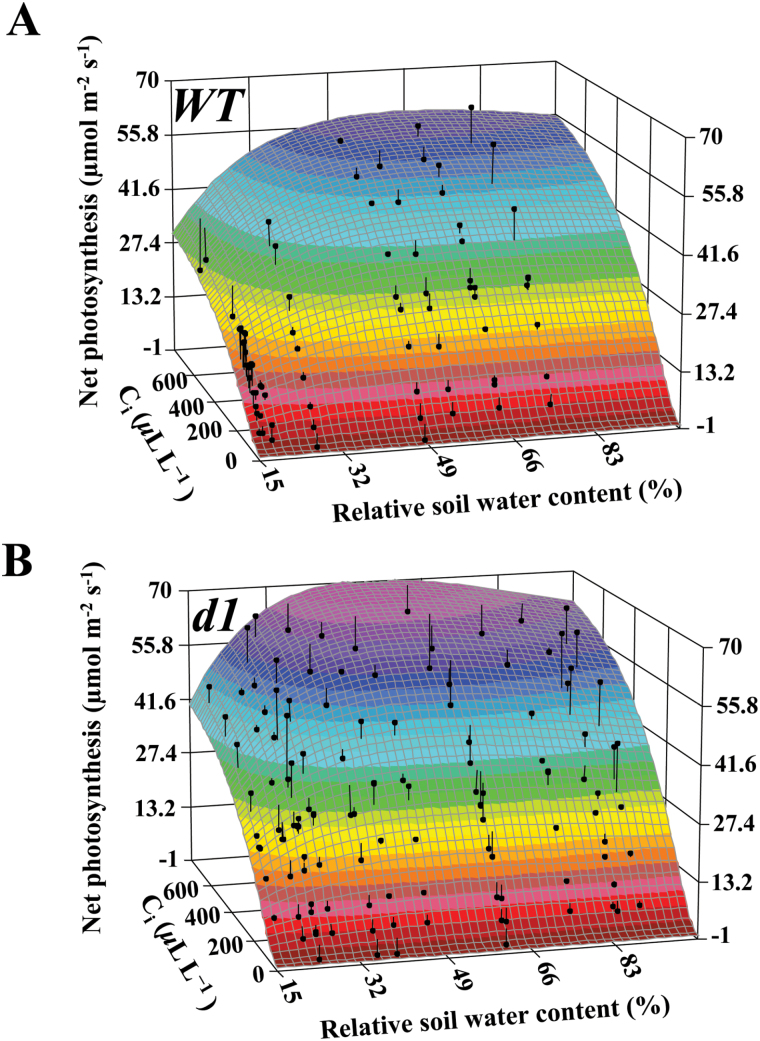
Fig. 6.
A/C i curves in relation to relative soil water content (RSWC) reveal a greater non-stomatal limitation of photosynthesis in the wild type (WT) as the RSWC decreases from 30%. 3D fitting of A/C i curves against RSWC for (A) the WT and (B) d1 as soil dries out reveals a differential response of the two genotypes in photosynthetic capacity in response to water limitation. As the RSWC decreases from 100% to 50%, there is an increase in the maximal photosynthetic capacity of d1, which exhibits higher maximal photosynthetic capacity (A max) as RSWC approaches 50%. As drought becomes more severe (RSWC ≤30%), there is a decrease in photosynthetic capacity in d1, which results from non-stomatal limitation that is more severe in the WT than in d1 (r 2 WT=0.93, dfWT=104; r 2 d1=0.95, dfd1=187). (This figure is available in colour at JXB online.)

