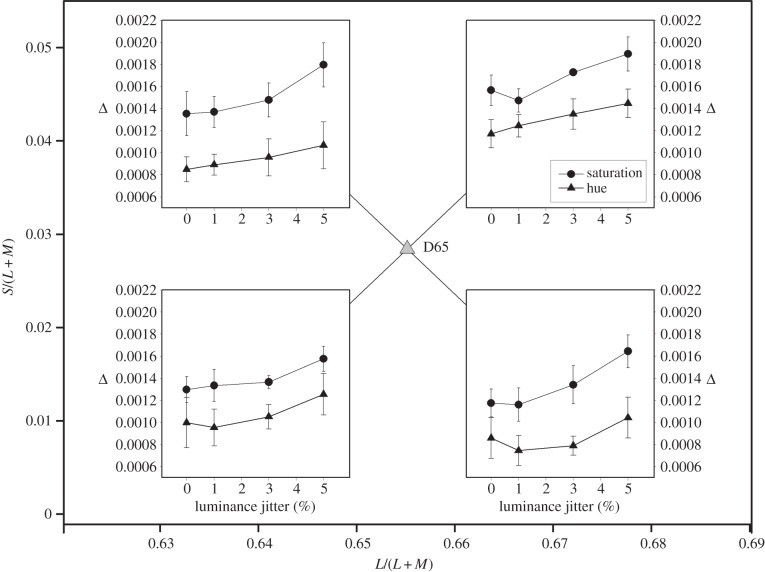
Figure 5.
Average thresholds for hue (triangles) and for saturation (circles) as a function of luminance jitter. The four sets of data are symbolically placed within the appropriate quadrants of the MacLeod–Boynton diagram. These measurements were all made at reference chromaticities that differed from D65 by 2% in their L/(L + M) coordinate. Error bars show ±1 s.e.m. and are based on the inter-observer variance.

