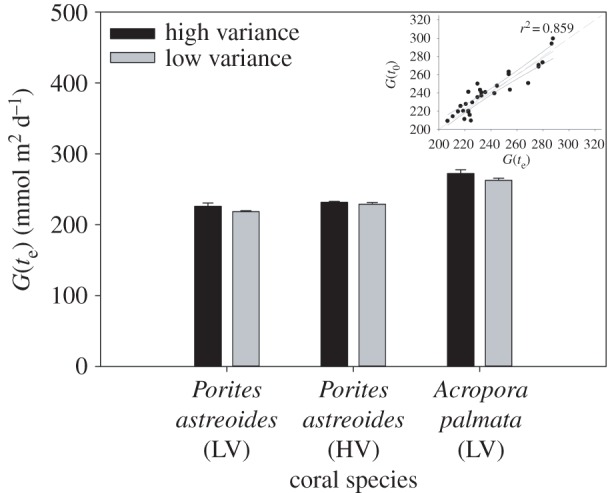
Figure 2.

Average (±s.e.) daily calcification rates (G) at the end of the experiment (te) for: A. palmata (outer-reef, low-variance (LV) habitat), P. astreoides (LV), and P. astreoides (seagrass, high-variance (HV) habitat) within the HV and LV control tanks. A regression between rates of G at the start (t0) and te of the experiment show strong colinearity between rates (r2 = 0.859, n = 30, p = 0.001, G(t0) (mmol m−2 d−1) = 18.55 + 0.93G(te) (mmol m−2 d−1).
