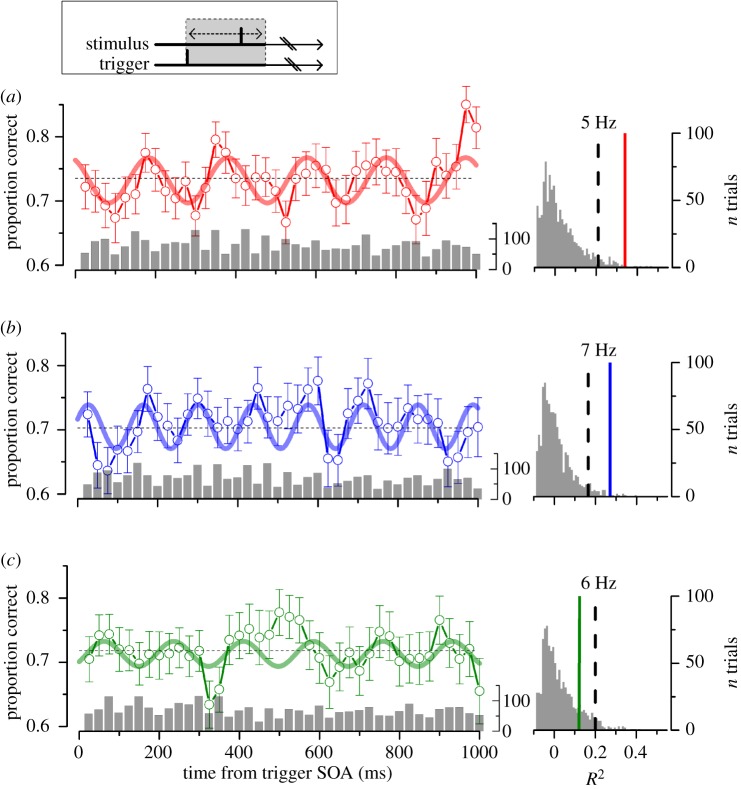
Figure 1.
Left: contrast discrimination performance as function of delay (stimulus onset asynchrony, SOA) from the self-trigger condition at high-luminance (a, self-HL; red) and at low-luminance (b, self-LL, blue); random-trigger condition at high-luminance (c, random-HL, green). Aggregate observer, n = 5. Bar plots show the number of independent observations for each bin (on average 74 ± 23). Vertical lines represent the s.e.m. from bootstrapping; thick lines represent the best sinusoidal fit to the data; horizontal dashed lines represent the average correct response. Right: adjusted-R2 distribution obtained by fitting the random shuffled data with the sinusoidal functions of a, b and c, respectively. Dashed lines mark 0.95 probability; thick lines mark the R2 for self-HL (p = 0.005), self-LL (p = 0.008) and random-HL condition (p = 0.12). (Online version in colour.)

