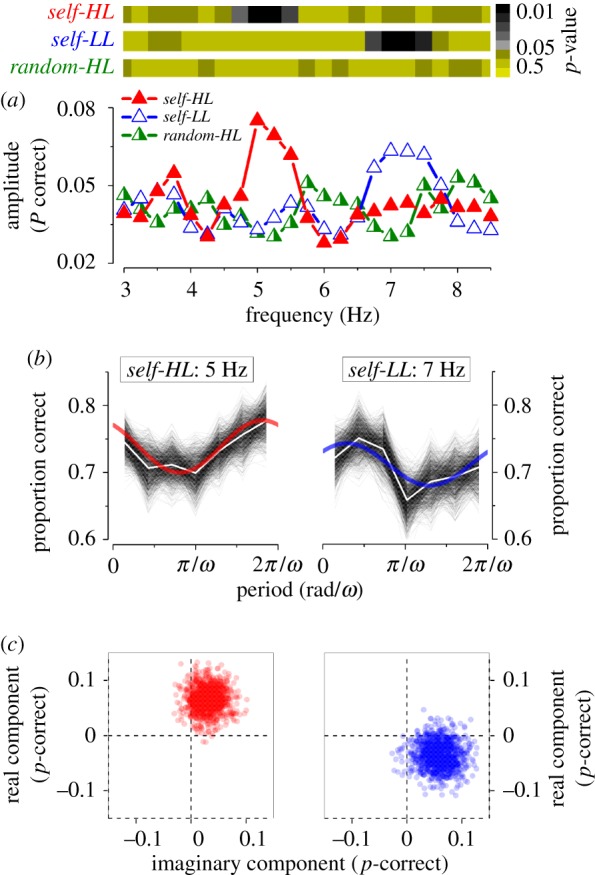
Figure 2.

Spectral analysis of visual performance of the aggregate observer. (a) Bottom: amplitude for self-HL (red filled triangles), self-LL (blue empty triangles) and random-HL (green half-filled triangles) conditions. Top: statistical significance in colour code for the three conditions calculated by a two-dimensional cluster spread derived by bootstrap as shown in (c). (b) Spectral analysis applied to the most significant harmonic component for self-HL and self-LL (5 and 7 Hz respectively). Bootstrap simulations (thin lines), their mean (white line) and best-fit model (continuous thick line) for the self-HL and self-LL conditions. (c) Two-dimensional polar statistics for the two most significant frequencies analysed. Real and imaginary components of each bootstrap for the self-trigger conditions. Points clustered away from the origin, indicating statistical significance as reported in (a) top row. (Online version in colour.)
