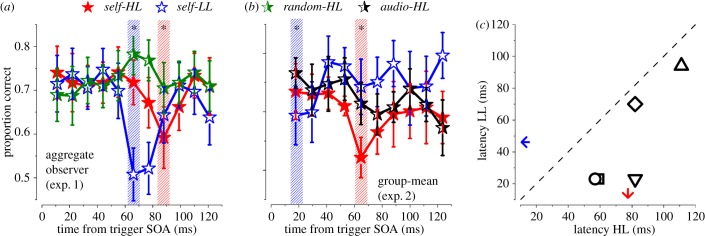
Figure 4.
Proportion correct in the first 120 ms from trigger in experiments 1 and 2. (a) Aggregated observer results for experiment 1 (n = 5). (b) Group subject mean and s.e.m for experiment 2 (n = 5). Red filled stars: self-HL; Blue empty stars: self-LL; Green half-filled stars: random-HL; Black half-filled stars: audio-HL. Dashed bars indicate points statistically different from the mean of the curves (binomial test). Asterisk: p < 0.05. (c) Scatter plot of individual subjects’ latency corresponding to the minimum performance for self-HL and self-LL conditions in experiment 2. The arrows indicate the means across subjects. All points are below the equality line, indicating the minimum performance is reached earlier at low than high luminance. Bin size is equal to 12 ms with 50% overlap. (Online version in colour.)

