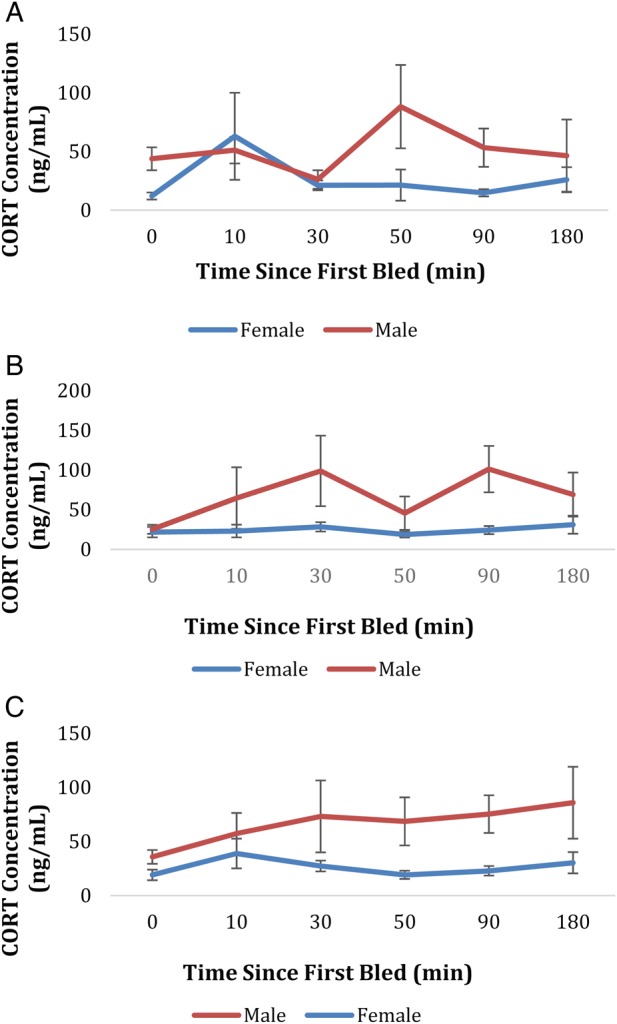
Figure 1:

(A) the stress-response curve for Chrysemys picta at Lost Mound Unit (LMU), the less human-impacted population. Time = 0 min indicates baseline corticosterone concentrations (see Materials and methods section for details). The data are corticosterone concentration on the y-axis and time since first bled on the x-axis. Standard error bars have been inserted for each time point for each sex. Sample sizes basal: male, n = 13 and female, n = 8. Sample sizes stress response: male n = 8 and female n = 3. (B) The stress-response curve for C. picta at Thomson Causeway Recreational Area (TCRA), the more human-impacted population. Sample sizes basal: male, n = 4 and female, n = 23. Sample sizes stress response: male n = 6 and female n = 16. (C) This graph represents the C. picta stress-response curve from both the less human-impacted population, LMU, and the more human-impacted population, TCRA. Sample sizes basal only: male, n = 23 and female, n = 31. Sample sizes stress response: male n = 14 and female n = 19.
