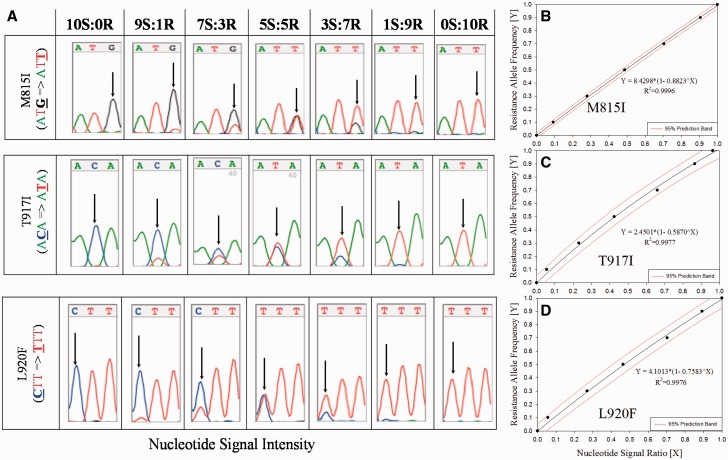
Fig. 1.
Generation of standard curves using quantitative sequencing for the determination of resistance allele frequencies (RAF) from collected lice. Nucleotide signal intensities for susceptible and resistant alleles at each mutation site (see arrows, Panel A, Fig. 1) were determined from the chromatograms, ratios calculated, and plotted versus RAF to yield standard regression equations (Panels B–D, Fig. 1) and used to calculate RAF from collected samples.

