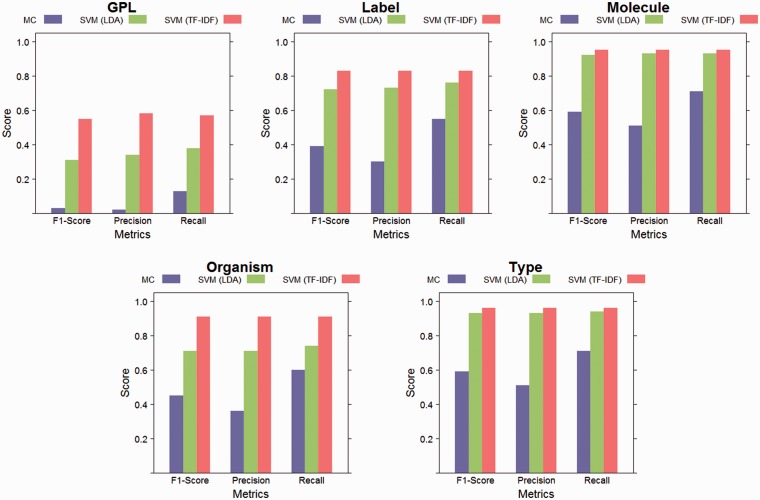
Figure 5.
Evaluation results. This figure shows weighted class averages for precision, recall and F1-Score for each structured element. Results are reported for linear SVM with LDA features, linear SVM with TF-IDF features and for the majority classifier (MC) baseline. While some information was lost during LDA’s dimensionality reduction (by 98%), both approaches performed better than the baseline for all elements.

