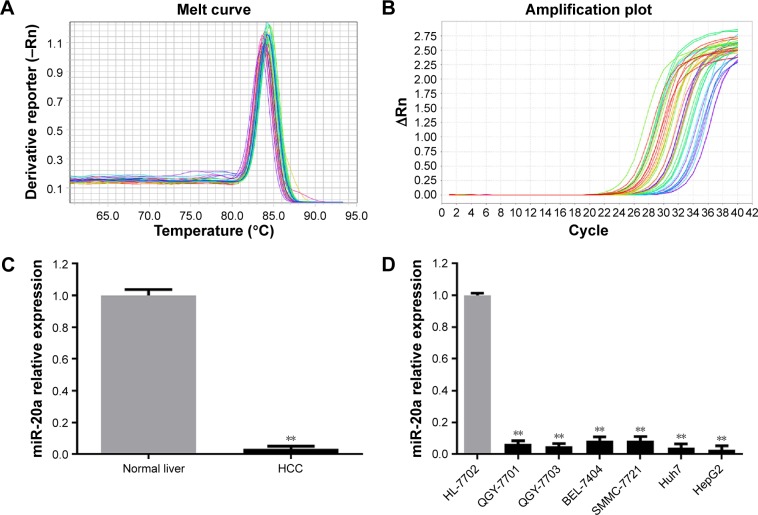
Figure 1.
Expression level of miR-20a in HCC versus normal tissues and cells detected by fluorescent quantitative PCR.
Notes: **P<0.05 when compared with normal liver or HL-7702. (A) Dissolution curve; (B) amplification curve; (C) miR-20a expression levels in liver cancer tissue and normal liver tissue; (D) miR-20a expression levels in liver cancer cells and normal liver cells. (C and D) Gray colored bars show the miR-20a expressions in normal liver tissues and normal liver cells; black colored bars show the miR-20a expressions in liver cancer tissues and liver cancer cells.
Abbreviations: HCC, hepatocellular carcinoma; miR, microRNA; PCR, polymerase chain reaction.

