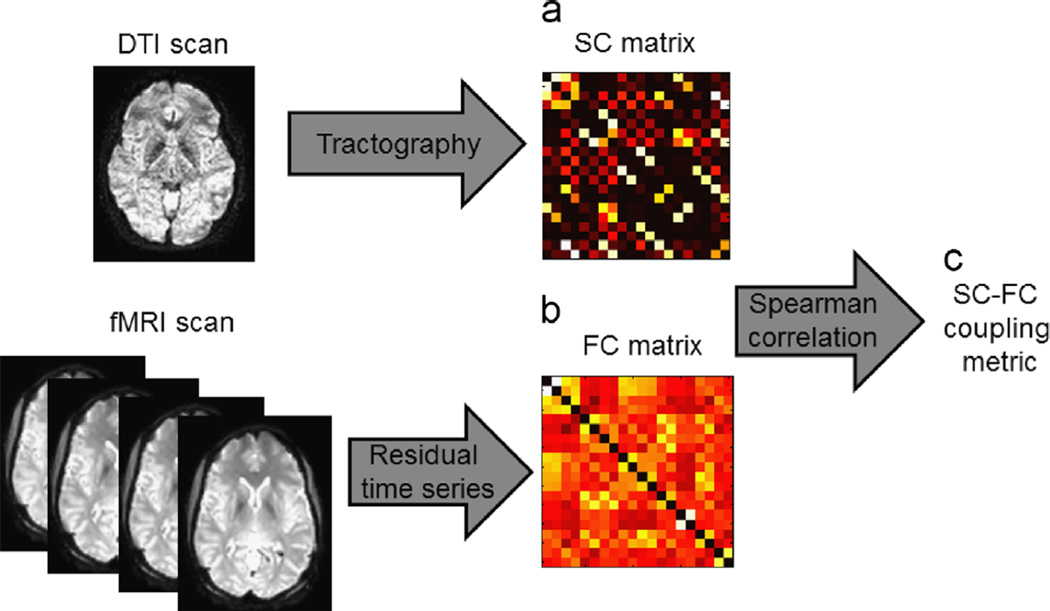
Fig. 2.
Schematic illustrating computation of SC–FC metric from fMRI and diffusion tensor imaging data. (a) Structural connectivity (SC) matrix is computed from DTI using tractography. (b) Functional connectivity (FC) matrix is computed from fMRI using the Pearson correlation between residual time series. (c) SC–FC coupling metric is calculated as the Spearman correlation between SC and FC matrices.

