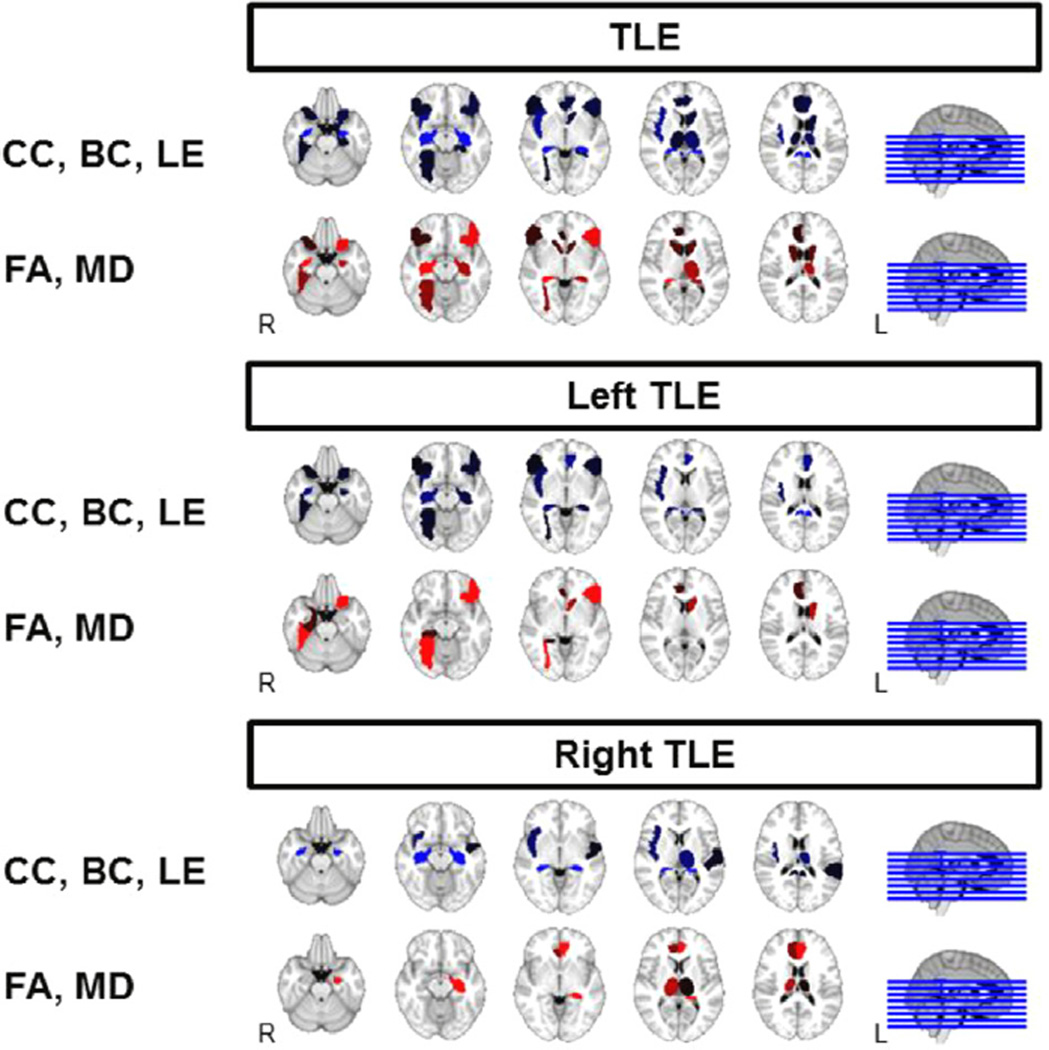
Fig. 4.
Comparison of regional structural and functional measures associated with SC–FC coupling levels in TLE. Brighter color indicates greater magnitude of association with SC–FC coupling. Orientation is radiological. CC, clustering coefficient; LE, local efficiency; BC, betweenness centrality; FA, fractional anisotropy; MD, mean diffusivity; R, right; L, left.

