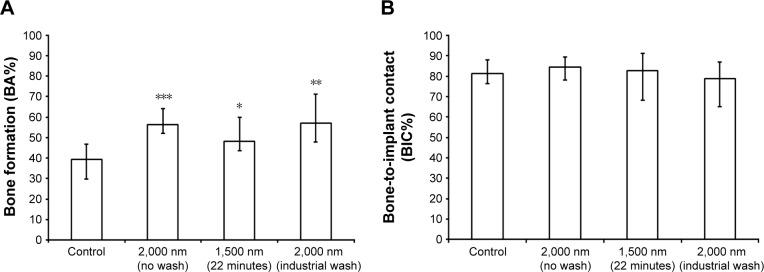
Figure 8.
In vivo data 12 weeks after implantation.
Notes: (A) Percentage of new bone formation (BA%). (B) Percentage of direct BIC. Significant differences with respect to grade 4 Ti reference are marked with *P<0.05, **P<0.01, and ***P<0.001.
Abbreviations: BA%, bone area percentage; BIC%, bone-to-implant contact percentage.

