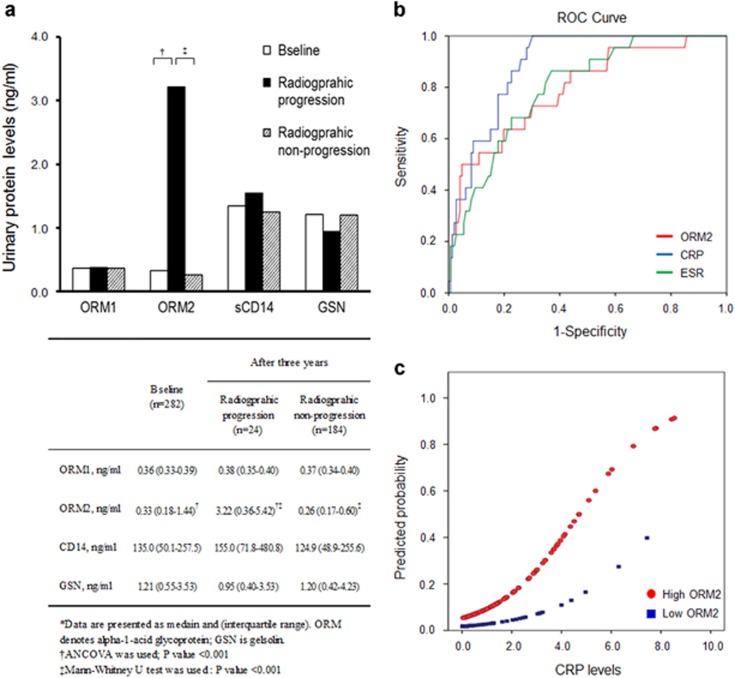
Figure 3.
Correlation of urinary ORM2 levels with radiographic progression of RA. (a) Urinary levels of ORM1, ORM2 and sCD14 in relation to the radiographic severity of RA. Radiographic severity was assessed by evaluating radiographic damage on X-rays of the hands and feet, which were taken at baseline and annually thereafter. Radiographic progression was defined as a progression score ⩾4. (b) ROC curve analysis for radiographic progression revealed that ORM2 had an area under the curve (AUC) comparable to those of ESR and CRP. The AUC was 0.79 for ORM2 (P<0.001), 0·81 for ESR (P<0.001) and 0.89 for CRP (P<0.001). (c) Probability plots for radiographic progression in relation to serum CRP levels in RA patients stratified by urinary ORM2 levels (high versus low ORM2).

