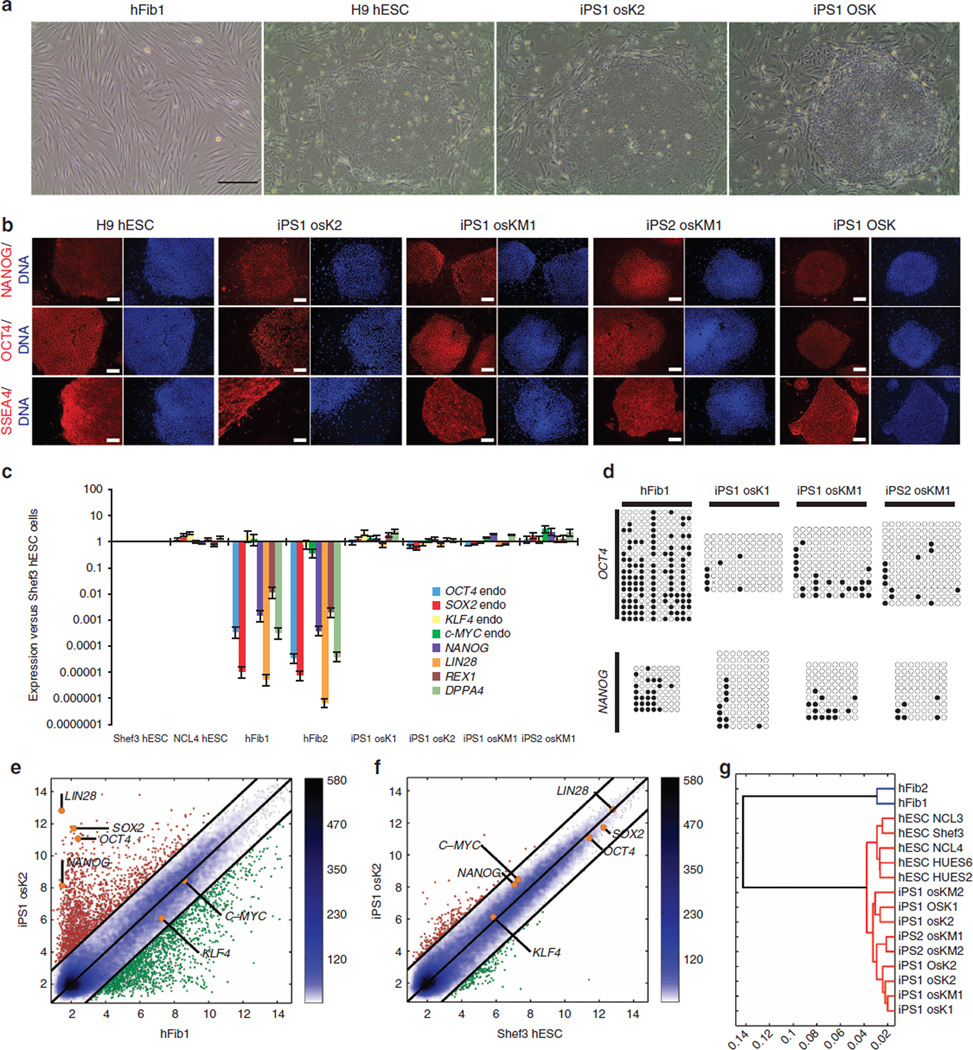
Figure 5. Generation and characterization of hiPSCs generated using Axolotl Oct4 and AxSox2.
(a) Representative images showing an iPSC colony generated using the axolotl factors in comparison with the initial hFib1 population, as a negative control, and iPSCs generated with only human factors (OSK) and H9 hESCs, as positive controls. Scale bars, 500 µm. (b) Immunofluorescence analysis of NANOG, OCT4 and SSEA4 on iPS1 osK2, iPS1 osKM1 and iPS2 osKM1 cell lines. Human ESC line H9 and OSK iPSC cell line were used as positive controls. Nuclei were stained with Hoechst (blue). Scale bars, 500 µm. (c) Expression of endogenous pluripotency markers in hFib1, hFib2, iPS1 osK1, iPS1 osK2, iPS1 osKM1 and iPS2 osKM1 cell lines as well as in Shef3 and NCL4 hESCs was measured by qRT–PCR and plotted relative to Shef3 hESC levels. Error bars reflect s.e. based on normalization to GAPDH and ACTB (housekeeping genes). (d) Bisulfite sequencing of genomic OCT4 and NANOG promoter regions. Open and closed circles indicate unmethylated and methylated CpGs, respectively. (e–g) Pairwise scatter plots of global gene expression profiles comparing iPS1 osK2 cells with human hFib1 cells (e) and Shef3 hESCs (f). Black lines indicate a two-fold change in gene expression levels between the paired populations. Colour bar on the right indicates scattering density. Genes up- and downregulated are shown by red and green circles, respectively. The position of the pluripotency marker genes OCT4, OX2, NANOG, KLF4, LIN28 and c-MYC is represented as orange circles. (g) Hierarchical clustering, with blue branches connecting human fibroblasts and red branches connecting pluripotent cell populations (iPSCs or hESCs).

