
Figure 2.
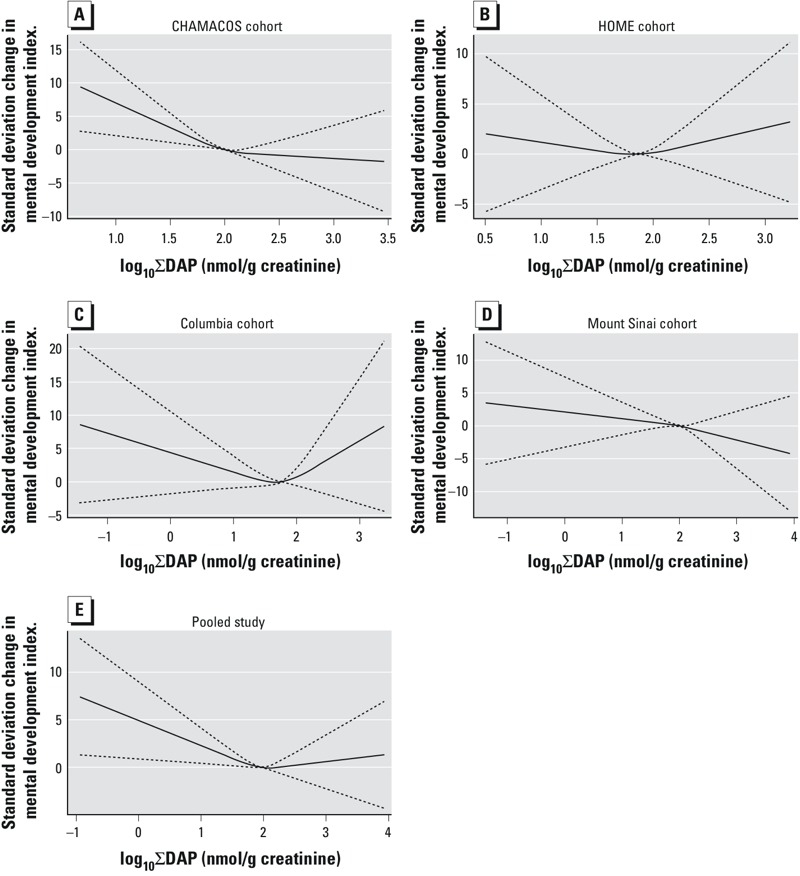
Restricted cubic splines for log10 ∑DAP association with the 24-month MDI in the (A) CHAMACOS cohort, (B) HOME cohort, (C) Columbia cohort, (D) Mount Sinai cohort, and (E) pooled population. Splines demonstrate a roughly linearly declining relationship in the individual cohorts and the overall pooled population below approximately 2 nmol/g creatinine, which attenuates at higher concentrations. Although the HOME (B) and Columbia (C) cohorts appear to show a U-shape curve, the 95% CIs (dashed lines) demonstrate substantial imprecision around these estimates.