
Figure 2.
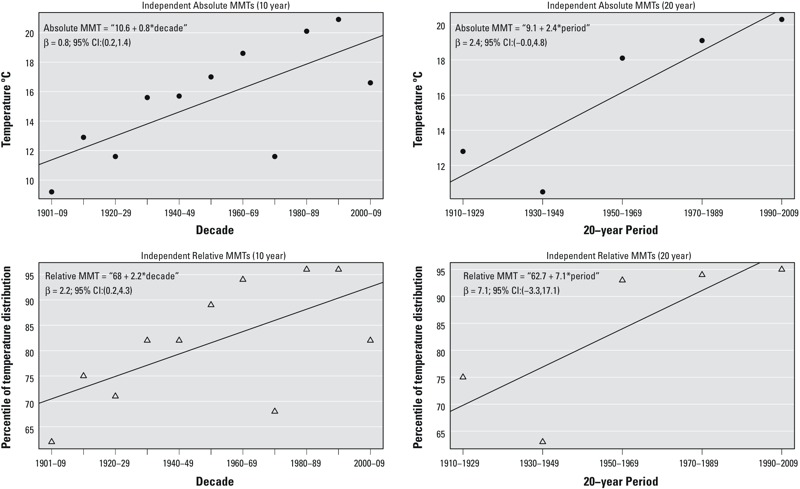
Independently estimated minimum mortality temperatures (MMTs) during 1901–2009 in Stockholm, Sweden. Filled circles indicate the absolute value of the estimated MMT (°C), and open triangles indicate the corresponding estimate of the MMT as a percentage of the temperature distribution. Estimates were derived using distributed lag non-linear models of independent 10- and 20-year periods with a 21-day lag, adjusted for weekdays, holidays, and smoothed time trends (8 degrees of freedom per year).