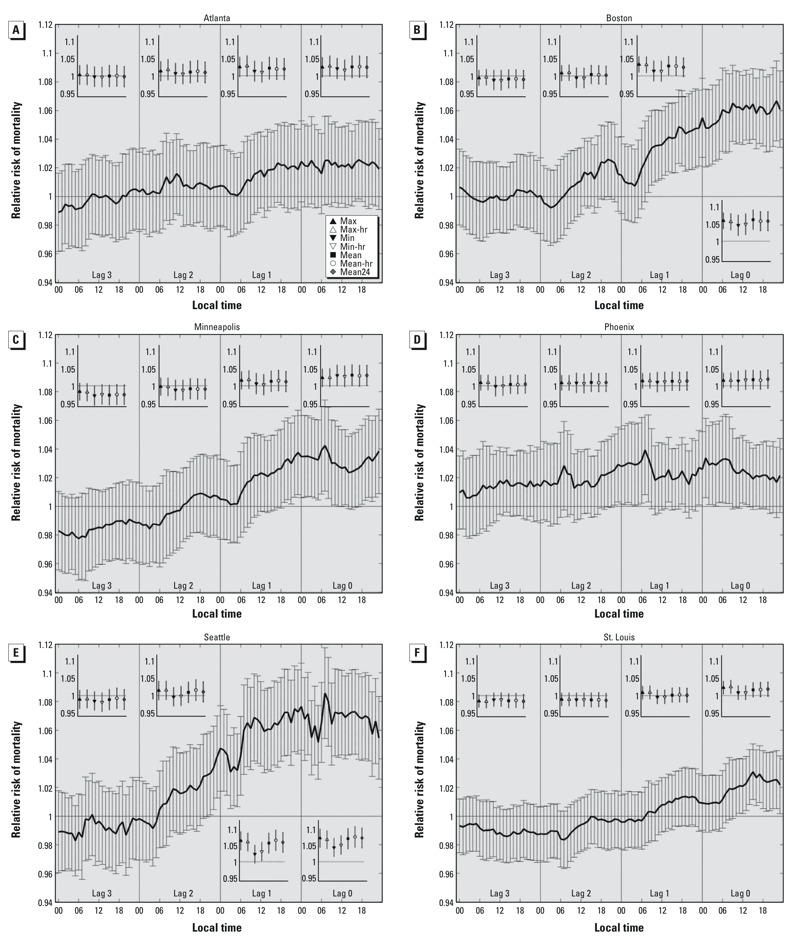
Figure 4.

Relative risks and 95% confidence intervals for mortality in association with each temperature metric at the 99th versus 85th percentile of the temperature distribution for (A) Atlanta, (B) Boston, (C) Minneapolis, (D) Phoenix, (E) Seattle, and (F) St. Louis, respectively. Each relative risk is estimated using a separate model for temperatures at each hour and on each lag day, where lag 0 represents the day of death, lags 1–3 represent the 1, 2, and 3 days before the day of death. Inset panels show relative risks for the seven daily temperature metrics on each lag day: max = maximum temperature; max-hr =maximum hourly temperature; min = minimum temperature; min-hr = minimum hourly temperature; mean = (max + min)/2; mean-hr = (max-hr + min-hr)/2; mean24 = average value of the 24 hourly temperatures. The key for the daily metrics is shown in A. All models are adjusted for time trends (7 df).
