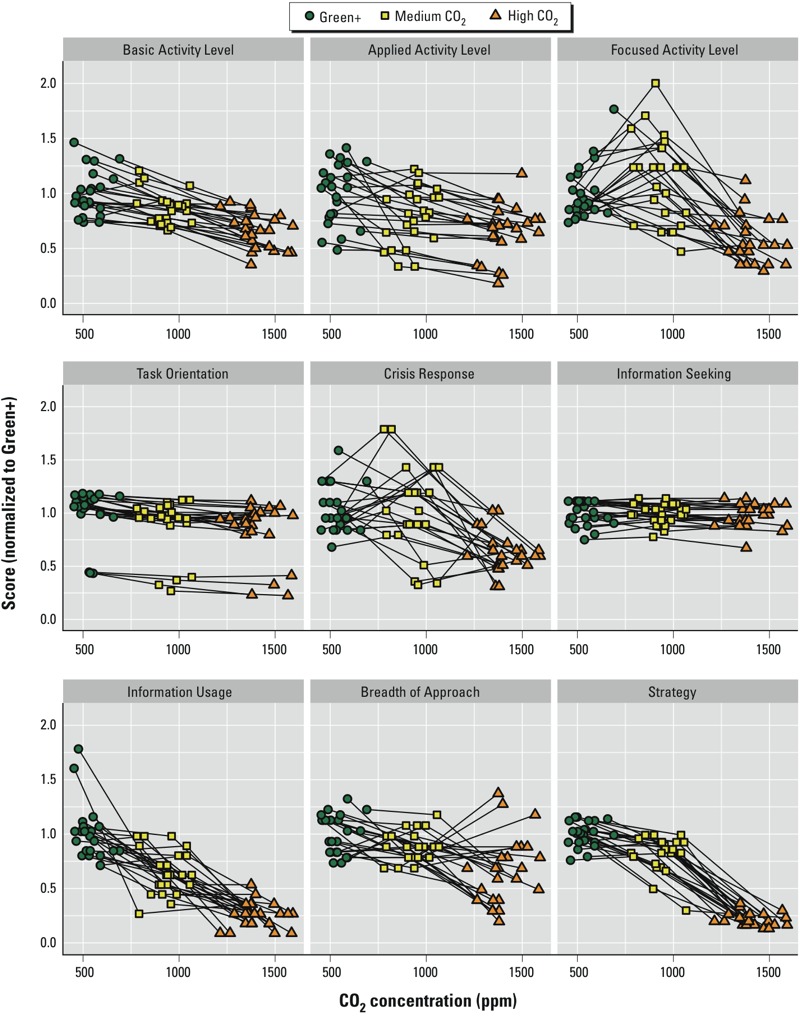
Figure 2.

Cognitive function scores by domain and participant and the corresponding carbon dioxide concentration in their cubicles. Each line represents the change in an individual’s CO2 exposure and cognitive scores from one condition to the next, normalized to the average CO2 exposure across all participants during the Green+ conditions.
