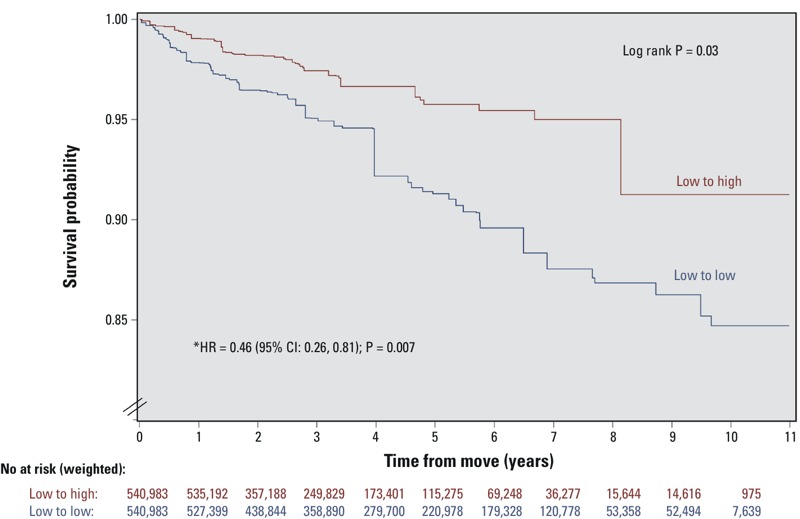
Figure 2.

Event-free survival for incident hypertension in a propensity score–matched cohort of participants who moved from low- to high-walkability areas vs. from low- to low-walkability areas. Low- and high-walkability areas were defined as Walk Score of < 90 and ≥ 90, respectively. The p-value tests the difference between the Kaplan–Meier survival curves using the log-rank test. All estimates were weighted by the survey sample weights and bootstrap methods were applied. The hazard ratios, 95% confidence intervals, and p-values were derived from a Cox proportional hazards model performed on the propensity score–matched study sample of 1,057 pairs of participants balanced on age, sex, income, education, marital status, urban/rural residence, immigrant status, race/ethnicity, smoking, diabetes, BMI, stress, leisure physical activity, alcohol consumption, fruit and vegetable consumption, and index year.
