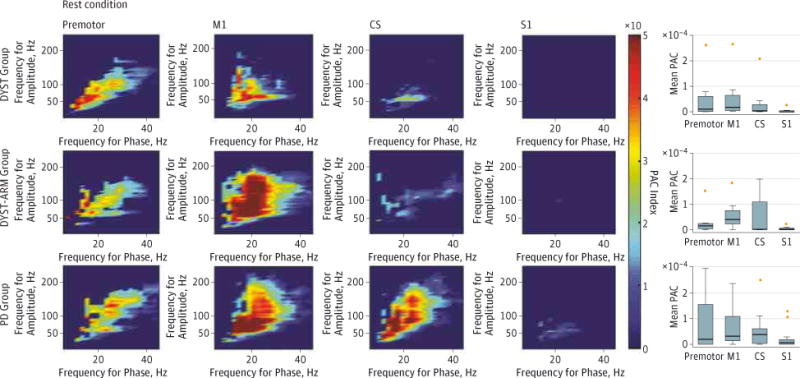
Figure 2. Phase-Amplitude Coupling (PAC) at Multiple Cortical Recording Locations for the 3 Patient Groups.

Patient groups include those with isolated dystonia with no arm symptoms contralateral to the electrocorticography (ECOG) side (DYST), with isolated dystonia with arm symptoms contralateral to the ECOG side (DYST-ARM), and with Parkinson disease (PD). Color indicates the value of the median PAC index for group data. The box plots show mean beta-broadband gamma PAC. For S1 vs M1, P = .002 for the DYST group, P = .004 for the DYST-ARM group, and P = .02 for the PD group (rank sum test for all comparisons). Horizontal lines represent medians of the individual patients’ mean PAC; boxes, the 25th and 75th percentiles; limit lines, the most extreme data points not considered outliers; and crosses, outliers (2 M1 outliers were not plotted, 80.7 × 10⁻⁴ for the DYST group and 31.1 × 10⁻⁴ for the PD group). Eleven patients did not have premotor contact. CS indicates central sulcus; M1, primary motor cortex; and S1, primary sensory cortex.
