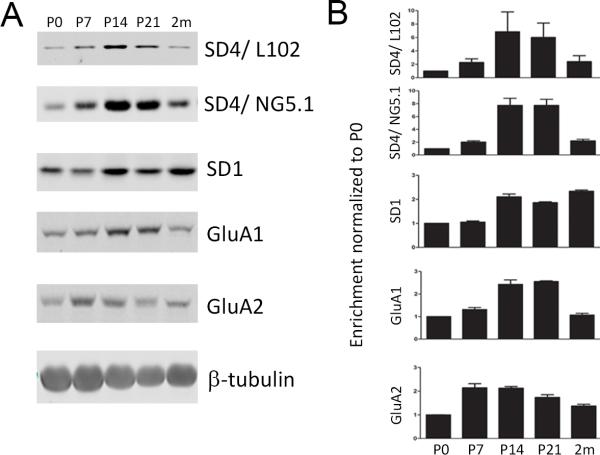
Figure 4. SynDIG4 expression peaks during synaptogenesis.
A: Representative immunoblots of rat brain homogenates prepared from P0, P7, P14, P21, and 2 months are shown.
B: Quantification of (A), normalized to beta-tubulin and compared to P0 for enrichment (n = 3). Multiple blots were run for analysis; each blot had its own beta-tubulin loading control, but for simplicity only one beta-tubulin blot is shown.

