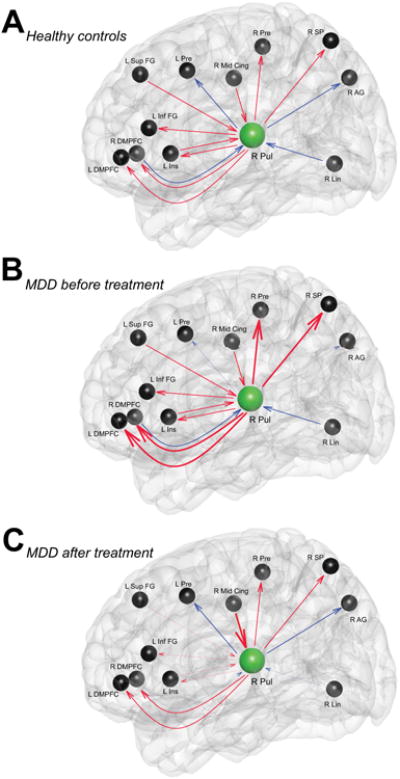
Figure 3.

Schematic illustration of pulvinar causal outflow and inflow in healthy controls (A), participants with MDD before (B) and after treatment (C). Red and blue lines indicate excitatory and inhibitory influences between nodes respectively. Thick and thin lines show stronger and weaker strengths of connectivity in MDD participants compared to healthy controls respectively. R Pul, right pulvinar; DMPFC, dorsomedial prefrontal cortex; Pre, Precentral; AG, Angular gyrus; SP, Superior Parietal; Sup FG, Superior Frontal gyrus; Ins, Insula; Inf FG, Inferior Frontal gyrus ; Lin, Lingual gyrus; Mid Cing, Middle Cingulate cortex.
