
Figure 4.
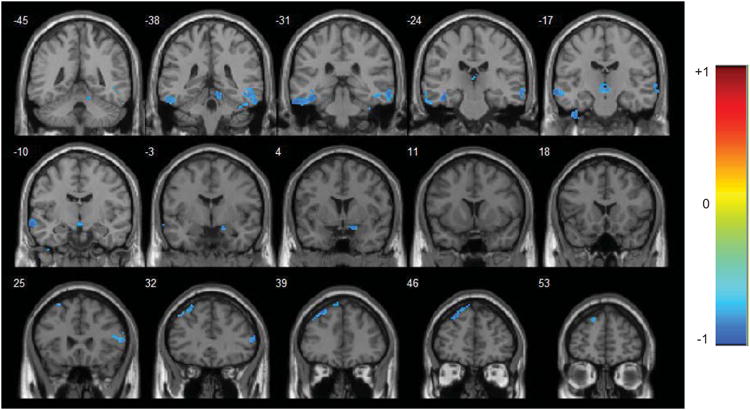
R-statistical maps illustrating correlation between change in HF functional connectivity and change in symptom severity in terms of HAMD score (pretreatment minus posttreatment values). Corrected for multiple comparison (p < 0.05). The color bar on the left side refers to the range of r values.