Figure 1.

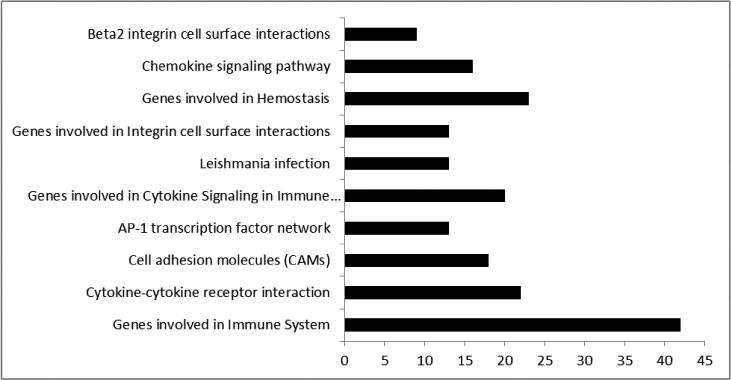
Gene Set Enrichment Analysis (GSEA) results between pulpitis and normal samples. Each bar represents the functional categories and the number of significantly regulated genes between pulpitis and normal groups (q<0.05).

Gene Set Enrichment Analysis (GSEA) results between pulpitis and normal samples. Each bar represents the functional categories and the number of significantly regulated genes between pulpitis and normal groups (q<0.05).