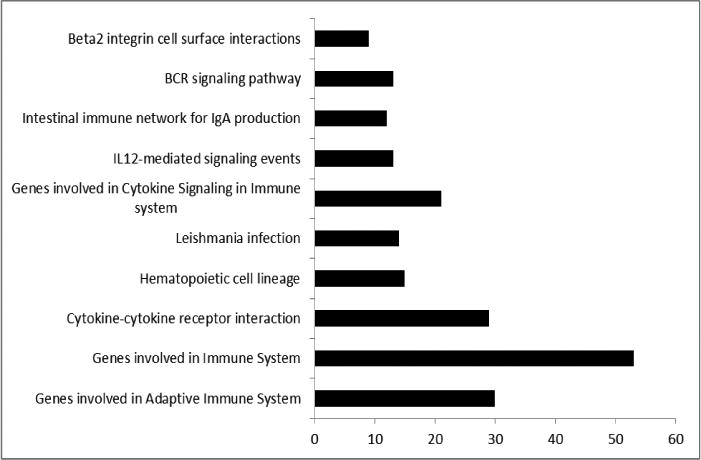
Figure 2.

GSEA results between groups that reported none to mild pain and those that reported moderate to severe pain on VAS. Each bar represents the functional categories and the number of significantly regulated genes between none to mild and moderate to severe pain groups (q<0.05).
