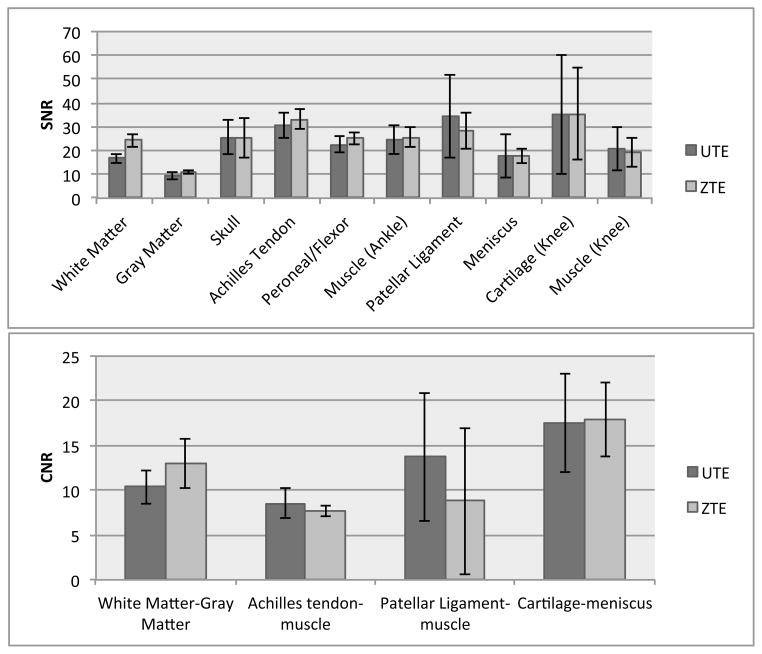
Figure 7.
SNR and CNR comparison of different tissue types between the ZTE and UTE images in the brain (N=5), ankle (N=5) and knee (N=3). There was no statistically significant difference between ZTE and UTE SNR (p > 0.05) for all tissues shown except for White Matter (p < 0.05). There was no statistically significant difference between the ZTE and UTE CNRs we examined (p > 0.05).

