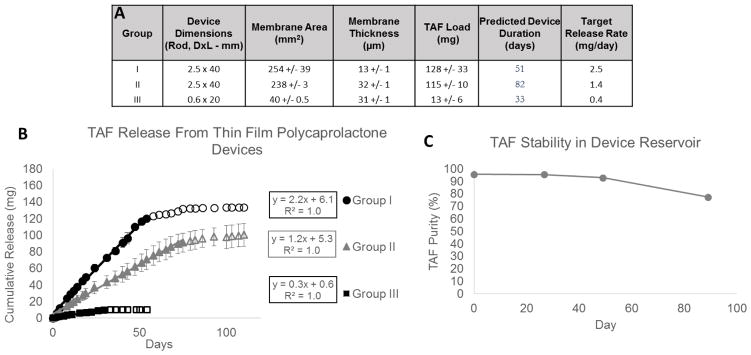
Figure 6. TAF TFPD Prototypes.
(A) Device parameters and predicted release rates for TAF TFPD prototype devices. Each group consists of n=3 devices and measurements represent average values +/− 1 standard deviation. (B) Cumulative release profiles for prototype device groups. Prototype devices are loaded with a 1:1 TAF:PEG300 (w/w) formulation. Release profile is linear (solid data points) until device nears depletion (outlined data points). Linear regression determines average release rate for each prototype group (mg/day). (C) Purity of TAF remaining in device reservoir after incubation under physiological conditions (PBS pH 7.4, 37°C).

