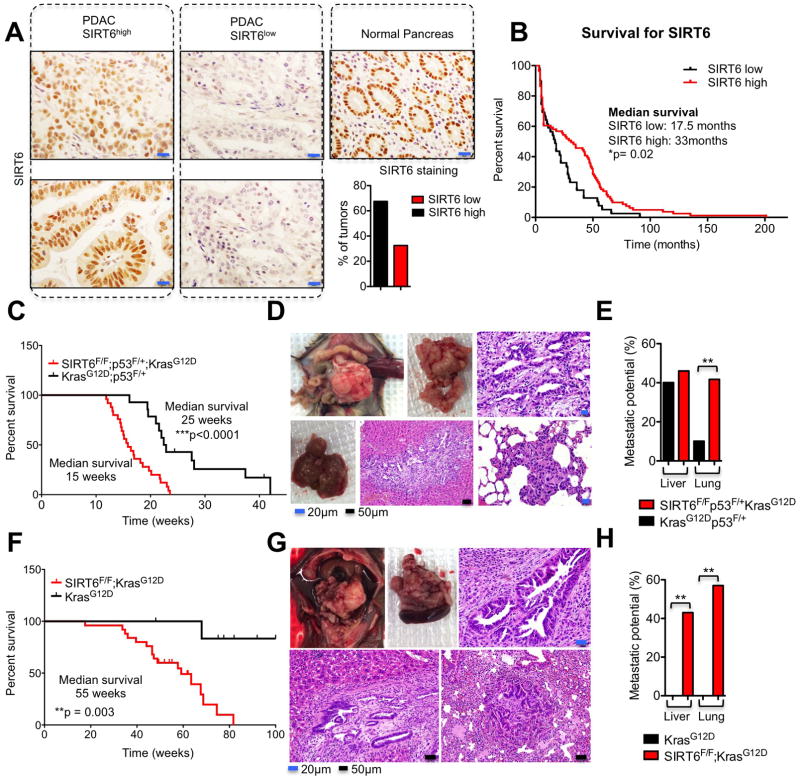
Figure 1. Loss of SIRT6 Cooperates with Oncogenic Kras to Accelerate PDAC.
A, Immunohistochemistry of SIRT6 in human PDAC samples (left & center) compared to normal pancreas (right) and quantification of IHC scoring (bottom right). B, Kaplan–Meier analysis of the indicated PDAC patient samples based on SIRT6 IHC score (n=120). C, Kaplan–Meier analysis of the indicated genetically engineered mouse models (GEMMs) showing time until signs of illness necessitated euthanasia. All animals euthanized had pancreatic tumors. D, Necropsy of Sirt6f/f;KrasG12D;p53f/+;p48-Cre (SIRT6 KO) GEMM euthanized at 13 weeks. Top left, Image of abdominal contents showing pancreatic mass and splenomegaly. Top middle, extracted SIRT6 KO tumor. Upper right, haematoxylin and eosin (H&E) staining showing PDAC histology. Bottom left, Gross image of liver with metastases. Bottom middle, H&E stain of liver metastasis. Bottom right, H&E stain of lung metastasis. E, Quantification of the metastatic potential of SIRT6 KO and Sirt6+/+;KrasG12D;p53f/+;p48-Cre (SIRT6 WT) GEMMs from the Kaplan-Meier analysis in Fig. 1C to the livers or the lungs. F, Kaplan–Meier analysis of the indicated genetically engineered mouse models (GEMMs) showing time until signs of illness necessitated euthanasia. All animals euthanized had pancreatic tumors. G, Necropsy of Sirt6f/f;KrasG12D;p53+/+;p48-Cre GEMM euthanized at 55 weeks. Top left, Image of abdominal contents showing pancreatic mass and splenomegaly. Top middle, extracted Sirt6f/f;KrasG12D;p53+/+;p48-Cre pancreatic tumor with spleen attached. Upper right, haematoxylin and eosin (H&E) staining showing PDAC histology. Bottom left, H&E of liver metastasis. Bottom right, H&E stain of lung metastasis. H, Quantification of the metastatic potential of Sirt6f/f;KrasG12D;p53+/+;p48-Cre and Sirt6+/+;KrasG12D;p53+/+;p48-Cre GEMMs from the Kaplan-Meier analysis in Fig. 1F to the livers or the lungs. Scale bars, black 50 μm, blue 20 μm. * p ≤ 0.05; ** p ≤ 0.01; *** p ≤ 0.001. See also Fig S1.

