
Figure 1. Map of US Cancer Registries With Volume of Incident Cancer Cases Recorded by Cancer Registries by Statea.
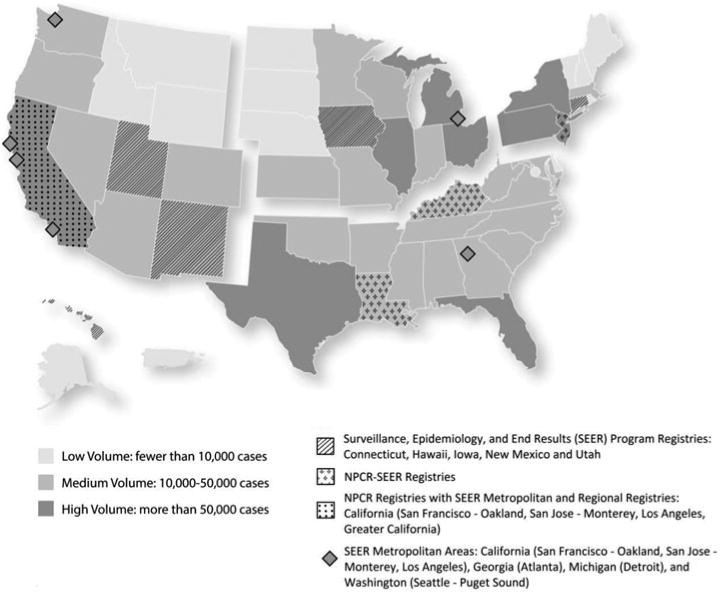
Abbreviation: NPCR, National Program of Cancer Registries. aOur analysis excludes Pacific Island Jurisdictions. The registry did not report cases diagnosed in 2006 and is still ramping up case reporting. Low case volume distorts cost per case calculations. We also exclude SEER (Connecticut, Hawaii, Iowa, New Mexico, and Utah), NPCR-SEER (Kentucky, Louisiana, New Jersey), NPCR states with SEER metro areas (Georgia, Michigan, and Washington), and NPCR states with SEER metro and regional coverage (California) from this study. Shading denotes case volume (low, medium, and high). Patterns denote federal funding sources in place at the time this study began (2009).