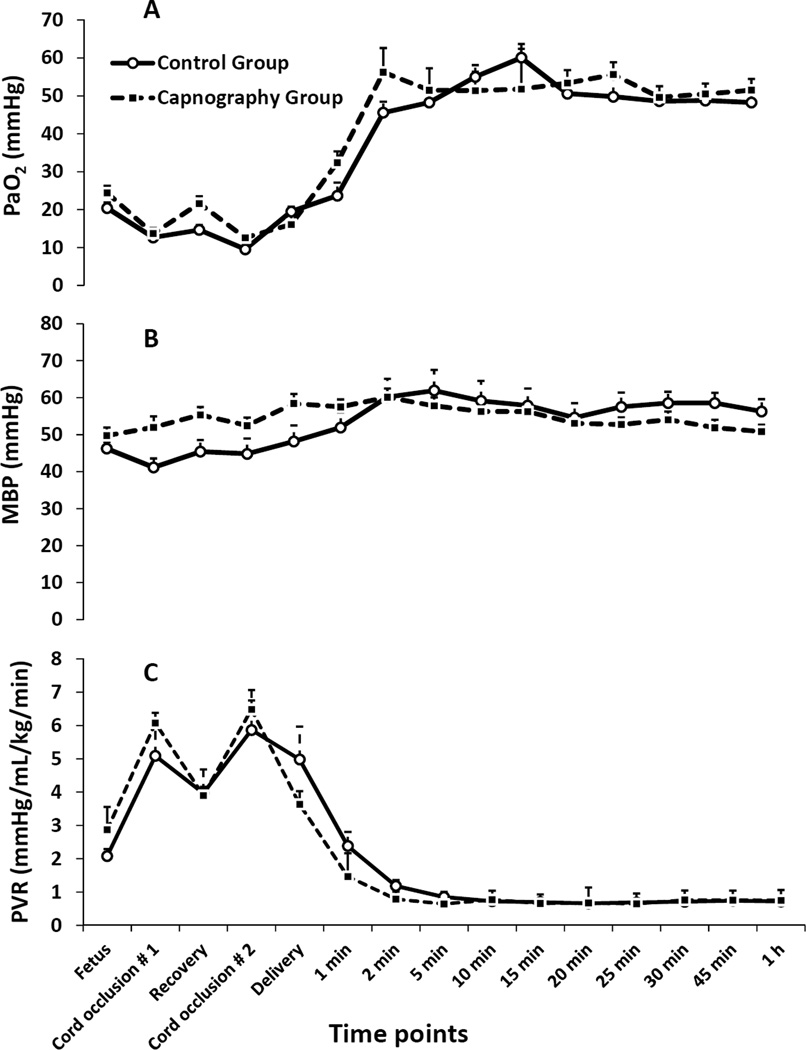
Figure 1.
(A) Preductal arterial oxygen tension in mmHg (PaO2), (B) mean systemic blood pressure in mmHg (MBP) and (C) pulmonary vascular resistance (PVR) in mmHg/ml/kg/min are represented by graphs. Data from fetal baseline values, cord occlusion for asphyxiation, resuscitation and the first 60 minutes of postnatal period are shown in the graph. Data were analyzed from 5 to 60 minutes of life. PaO2, MBP and PVR were similar between groups.

