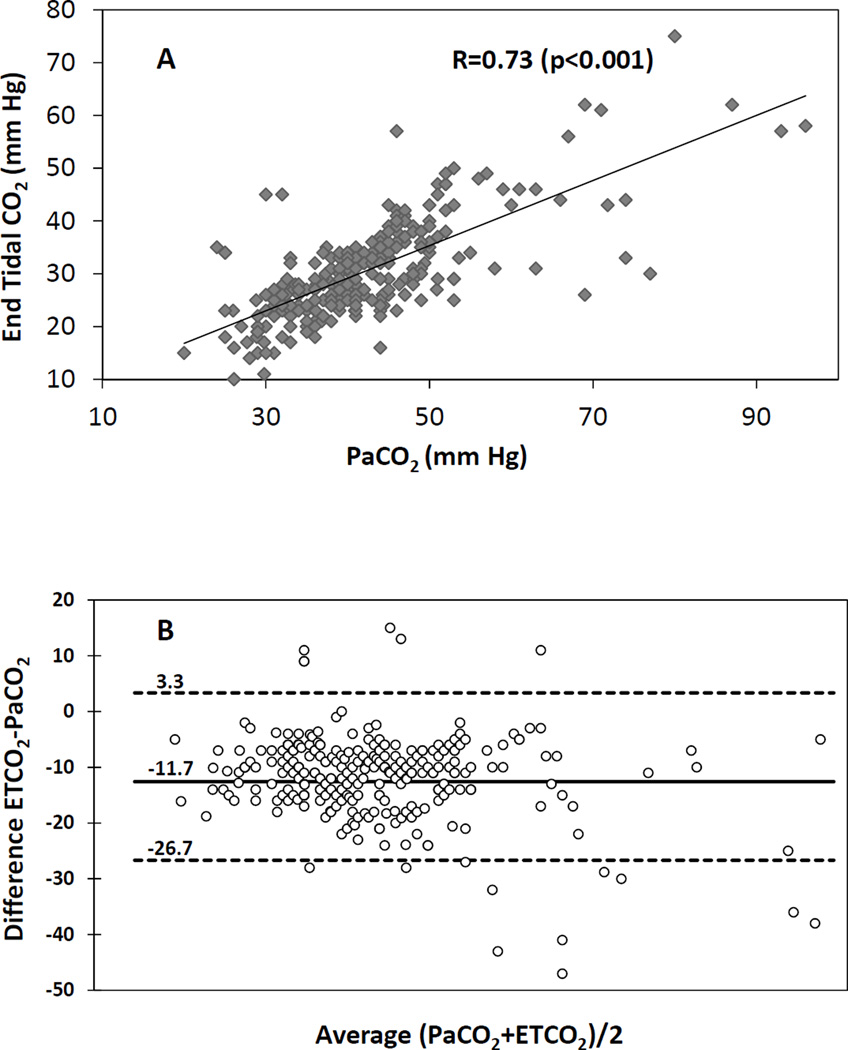
Figure 2.
(A) Scatter plot of end-tidal carbon dioxide (ETCO2) and arterial carbon dioxide (PaCO2) values from 5–60 minutes of age showed good correlation (r-0.73, rho-0.7, p<0.001). (B) The agreement between ETCO2 and PaCO2 is illustrated as Bland Altman plot. The ETCO2 was lower than PaCO2 with a mean bias of −11.7+/− 7.7 mm Hg with confidence interval of −26.7, 3.3 mm Hg.

